Performance Analysis and Optimization of the Hurricane File System ...
Performance Analysis and Optimization of the Hurricane File System ...
Performance Analysis and Optimization of the Hurricane File System ...

You also want an ePaper? Increase the reach of your titles
YUMPU automatically turns print PDFs into web optimized ePapers that Google loves.
CHAPTER 5. MICROBENCHMARKS – READ OPERATION 35<br />
avg # cycles per processor<br />
2e+08<br />
1e+08<br />
5e+07<br />
0e+00<br />
thread<br />
0<br />
cpu 0<br />
$$$$<br />
0<br />
thread<br />
1<br />
cpu 1<br />
thread<br />
n<br />
cpu n<br />
$$$$ $$$$<br />
1 n<br />
HFS<br />
disk 0 disk 1 disk n<br />
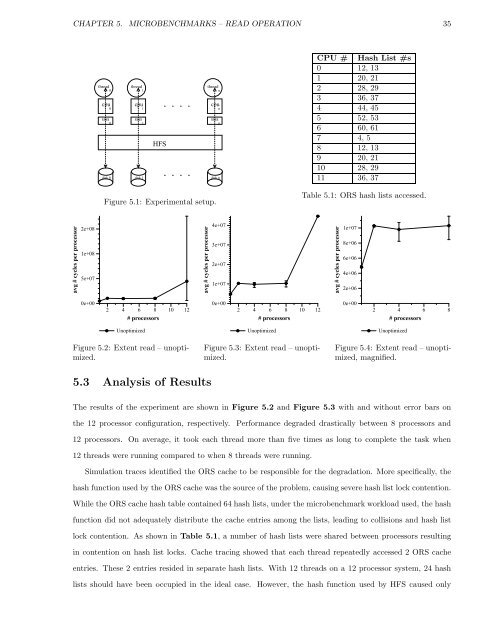
Figure 5.1: Experimental setup.<br />
2 4 6 8 10 12<br />
# processors<br />
Unoptimized<br />
Figure 5.2: Extent read – unoptimized.<br />
avg # cycles per processor<br />
5.3 <strong>Analysis</strong> <strong>of</strong> Results<br />
4e+07<br />
3e+07<br />
2e+07<br />
1e+07<br />
0e+00<br />
2 4 6 8 10 12<br />
# processors<br />
Unoptimized<br />
Figure 5.3: Extent read – unoptimized.<br />
CPU # Hash List #s<br />
0 12, 13<br />
1 20, 21<br />
2 28, 29<br />
3 36, 37<br />
4 44, 45<br />
5 52, 53<br />
6 60, 61<br />
7 4, 5<br />
8 12, 13<br />
9 20, 21<br />
10 28, 29<br />
11 36, 37<br />
Table 5.1: ORS hash lists accessed.<br />
avg # cycles per processor<br />
1e+07<br />
8e+06<br />
6e+06<br />
4e+06<br />
2e+06<br />
0e+00<br />
2 4 6 8<br />
# processors<br />
Unoptimized<br />
Figure 5.4: Extent read – unoptimized,<br />
magnified.<br />
The results <strong>of</strong> <strong>the</strong> experiment are shown in Figure 5.2 <strong>and</strong> Figure 5.3 with <strong>and</strong> without error bars on<br />
<strong>the</strong> 12 processor configuration, respectively. <strong>Performance</strong> degraded drastically between 8 processors <strong>and</strong><br />
12 processors. On average, it took each thread more than five times as long to complete <strong>the</strong> task when<br />
12 threads were running compared to when 8 threads were running.<br />
Simulation traces identified <strong>the</strong> ORS cache to be responsible for <strong>the</strong> degradation. More specifically, <strong>the</strong><br />
hash function used by <strong>the</strong> ORS cache was <strong>the</strong> source <strong>of</strong> <strong>the</strong> problem, causing severe hash list lock contention.<br />
While <strong>the</strong> ORS cache hash table contained 64 hash lists, under <strong>the</strong> microbenchmark workload used, <strong>the</strong> hash<br />
function did not adequately distribute <strong>the</strong> cache entries among <strong>the</strong> lists, leading to collisions <strong>and</strong> hash list<br />
lock contention. As shown in Table 5.1, a number <strong>of</strong> hash lists were shared between processors resulting<br />
in contention on hash list locks. Cache tracing showed that each thread repeatedly accessed 2 ORS cache<br />
entries. These 2 entries resided in separate hash lists. With 12 threads on a 12 processor system, 24 hash<br />
lists should have been occupied in <strong>the</strong> ideal case. However, <strong>the</strong> hash function used by HFS caused only