Performance Analysis and Optimization of the Hurricane File System ...
Performance Analysis and Optimization of the Hurricane File System ...
Performance Analysis and Optimization of the Hurricane File System ...

Create successful ePaper yourself
Turn your PDF publications into a flip-book with our unique Google optimized e-Paper software.
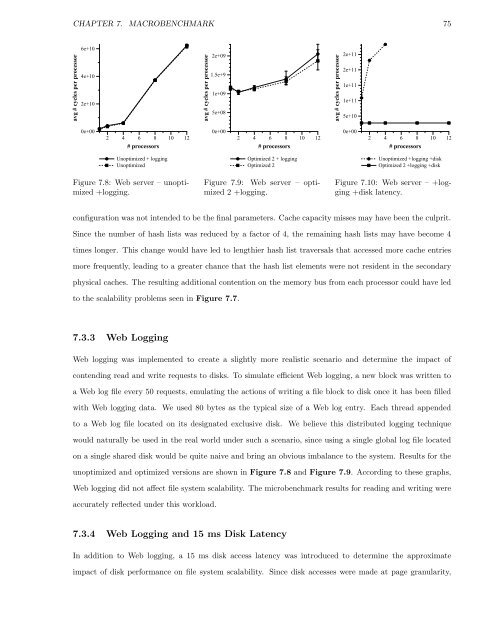
CHAPTER 7. MACROBENCHMARK 75<br />
avg # cycles per processor<br />
6e+10<br />
4e+10<br />
2e+10<br />
0e+00<br />
2 4 6 8 10 12<br />
# processors<br />
Unoptimized + logging<br />
Unoptimized<br />
Figure 7.8: Web server – unoptimized<br />
+logging.<br />
avg # cycles per processor<br />
2e+09<br />
1.5e+9<br />
1e+09<br />
5e+08<br />
0e+00<br />
2 4 6 8 10 12<br />
# processors<br />
Optimized 2 + logging<br />
Optimized 2<br />
Figure 7.9: Web server – optimized<br />
2 +logging.<br />
avg # cycles per processor<br />
2e+11<br />
2e+11<br />
1e+11<br />
1e+11<br />
5e+10<br />
0e+00<br />
2 4 6 8 10 12<br />
# processors<br />
Unoptimized +logging +disk<br />
Optimized 2 +logging +disk<br />
Figure 7.10: Web server – +logging<br />
+disk latency.<br />
configuration was not intended to be <strong>the</strong> final parameters. Cache capacity misses may have been <strong>the</strong> culprit.<br />
Since <strong>the</strong> number <strong>of</strong> hash lists was reduced by a factor <strong>of</strong> 4, <strong>the</strong> remaining hash lists may have become 4<br />
times longer. This change would have led to lengthier hash list traversals that accessed more cache entries<br />
more frequently, leading to a greater chance that <strong>the</strong> hash list elements were not resident in <strong>the</strong> secondary<br />
physical caches. The resulting additional contention on <strong>the</strong> memory bus from each processor could have led<br />
to <strong>the</strong> scalability problems seen in Figure 7.7.<br />
7.3.3 Web Logging<br />
Web logging was implemented to create a slightly more realistic scenario <strong>and</strong> determine <strong>the</strong> impact <strong>of</strong><br />
contending read <strong>and</strong> write requests to disks. To simulate efficient Web logging, a new block was written to<br />
a Web log file every 50 requests, emulating <strong>the</strong> actions <strong>of</strong> writing a file block to disk once it has been filled<br />
with Web logging data. We used 80 bytes as <strong>the</strong> typical size <strong>of</strong> a Web log entry. Each thread appended<br />
to a Web log file located on its designated exclusive disk. We believe this distributed logging technique<br />
would naturally be used in <strong>the</strong> real world under such a scenario, since using a single global log file located<br />
on a single shared disk would be quite naive <strong>and</strong> bring an obvious imbalance to <strong>the</strong> system. Results for <strong>the</strong><br />
unoptimized <strong>and</strong> optimized versions are shown in Figure 7.8 <strong>and</strong> Figure 7.9. According to <strong>the</strong>se graphs,<br />
Web logging did not affect file system scalability. The microbenchmark results for reading <strong>and</strong> writing were<br />
accurately reflected under this workload.<br />
7.3.4 Web Logging <strong>and</strong> 15 ms Disk Latency<br />
In addition to Web logging, a 15 ms disk access latency was introduced to determine <strong>the</strong> approximate<br />
impact <strong>of</strong> disk performance on file system scalability. Since disk accesses were made at page granularity,