Abstract
Abstract
Abstract

Create successful ePaper yourself
Turn your PDF publications into a flip-book with our unique Google optimized e-Paper software.
CHAPTER 3. BIFURCATION ANALYSIS 47<br />
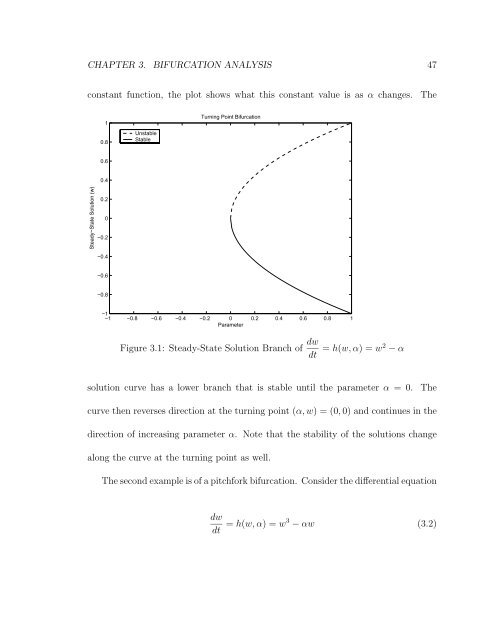
constant function, the plot shows what this constant value is as α changes. The<br />
Steady−State Solution (w)<br />
1<br />
0.8<br />
0.6<br />
0.4<br />
0.2<br />
0<br />
−0.2<br />
−0.4<br />
−0.6<br />
−0.8<br />
Unstable<br />
Stable<br />
Turning Point Bifurcation<br />
−1<br />
−1 −0.8 −0.6 −0.4 −0.2 0<br />
Parameter<br />
0.2 0.4 0.6 0.8 1<br />
Figure 3.1: Steady-State Solution Branch of dw<br />
dt = h(w, α) =w2 − α<br />
solution curve has a lower branch that is stable until the parameter α =0. The<br />
curve then reverses direction at the turning point (α, w) =(0, 0) and continues in the<br />
direction of increasing parameter α. Note that the stability of the solutions change<br />
along the curve at the turning point as well.<br />
The second example is of a pitchfork bifurcation. Consider the differential equation<br />
dw<br />
dt = h(w, α) =w3 − αw (3.2)