Abstract
Abstract
Abstract

You also want an ePaper? Increase the reach of your titles
YUMPU automatically turns print PDFs into web optimized ePapers that Google loves.
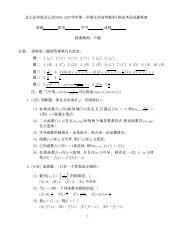
CHAPTER 3. BIFURCATION ANALYSIS 68<br />
Current Density (A/cm 2 )<br />
x Grid 105<br />
7<br />
6<br />
5<br />
4<br />
3<br />
2<br />
1<br />
0<br />
Refinement<br />
nx=512, nk=2048<br />
nx=1024, nk=2048<br />
nx=86, nk=72<br />
−1<br />
0 0.05 0.1 0.15 0.2 0.25 0.3 0.35 0.4 0.45 0.5<br />
Applied Voltage (V)<br />
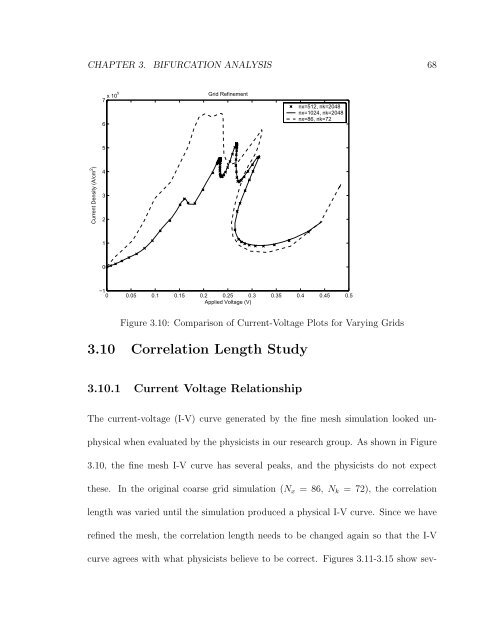
Figure 3.10: Comparison of Current-Voltage Plots for Varying Grids<br />
3.10 Correlation Length Study<br />
3.10.1 Current Voltage Relationship<br />
The current-voltage (I-V) curve generated by the fine mesh simulation looked un-<br />
physical when evaluated by the physicists in our research group. As shown in Figure<br />
3.10, the fine mesh I-V curve has several peaks, and the physicists do not expect<br />
these. In the original coarse grid simulation (Nx = 86, Nk = 72), the correlation<br />
length was varied until the simulation produced a physical I-V curve. Since we have<br />
refined the mesh, the correlation length needs to be changed again so that the I-V<br />
curve agrees with what physicists believe to be correct. Figures 3.11-3.15 show sev-