

NOx Emissions Impacts from Widespread Deployment of CHP in ...
NOx Emissions Impacts from Widespread Deployment of CHP in ...
NOx Emissions Impacts from Widespread Deployment of CHP in ...

You also want an ePaper? Increase the reach of your titles
YUMPU automatically turns print PDFs into web optimized ePapers that Google loves.
<strong>NOx</strong> <strong>Emissions</strong> Report<br />
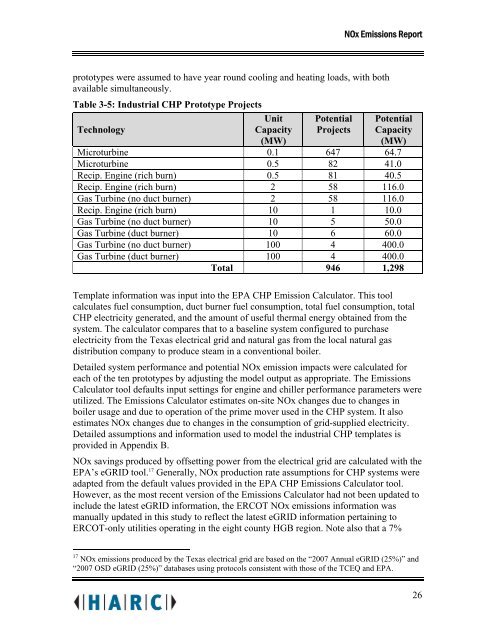
prototypes were assumed to have year round cool<strong>in</strong>g and heat<strong>in</strong>g loads, with both<br />
available simultaneously.<br />
Table 3-5: Industrial <strong>CHP</strong> Prototype Projects<br />
Technology<br />
Unit<br />
Capacity<br />
(MW)<br />
Potential<br />
Projects<br />
Potential<br />
Capacity<br />
(MW)<br />
Microturb<strong>in</strong>e 0.1 647 64.7<br />
Microturb<strong>in</strong>e 0.5 82 41.0<br />
Recip. Eng<strong>in</strong>e (rich burn) 0.5 81 40.5<br />
Recip. Eng<strong>in</strong>e (rich burn) 2 58 116.0<br />
Gas Turb<strong>in</strong>e (no duct burner) 2 58 116.0<br />
Recip. Eng<strong>in</strong>e (rich burn) 10 1 10.0<br />
Gas Turb<strong>in</strong>e (no duct burner) 10 5 50.0<br />
Gas Turb<strong>in</strong>e (duct burner) 10 6 60.0<br />
Gas Turb<strong>in</strong>e (no duct burner) 100 4 400.0<br />
Gas Turb<strong>in</strong>e (duct burner) 100 4 400.0<br />
Total 946 1,298<br />
Template <strong>in</strong>formation was <strong>in</strong>put <strong>in</strong>to the EPA <strong>CHP</strong> Emission Calculator. This tool<br />
calculates fuel consumption, duct burner fuel consumption, total fuel consumption, total<br />
<strong>CHP</strong> electricity generated, and the amount <strong>of</strong> useful thermal energy obta<strong>in</strong>ed <strong>from</strong> the<br />
system. The calculator compares that to a basel<strong>in</strong>e system configured to purchase<br />
electricity <strong>from</strong> the Texas electrical grid and natural gas <strong>from</strong> the local natural gas<br />
distribution company to produce steam <strong>in</strong> a conventional boiler.<br />
Detailed system performance and potential <strong>NOx</strong> emission impacts were calculated for<br />
each <strong>of</strong> the ten prototypes by adjust<strong>in</strong>g the model output as appropriate. The <strong>Emissions</strong><br />
Calculator tool defaults <strong>in</strong>put sett<strong>in</strong>gs for eng<strong>in</strong>e and chiller performance parameters were<br />
utilized. The <strong>Emissions</strong> Calculator estimates on-site <strong>NOx</strong> changes due to changes <strong>in</strong><br />
boiler usage and due to operation <strong>of</strong> the prime mover used <strong>in</strong> the <strong>CHP</strong> system. It also<br />
estimates <strong>NOx</strong> changes due to changes <strong>in</strong> the consumption <strong>of</strong> grid-supplied electricity.<br />
Detailed assumptions and <strong>in</strong>formation used to model the <strong>in</strong>dustrial <strong>CHP</strong> templates is<br />
provided <strong>in</strong> Appendix B.<br />
<strong>NOx</strong> sav<strong>in</strong>gs produced by <strong>of</strong>fsett<strong>in</strong>g power <strong>from</strong> the electrical grid are calculated with the<br />
EPA’s eGRID tool. 17 Generally, <strong>NOx</strong> production rate assumptions for <strong>CHP</strong> systems were<br />
adapted <strong>from</strong> the default values provided <strong>in</strong> the EPA <strong>CHP</strong> <strong>Emissions</strong> Calculator tool.<br />
However, as the most recent version <strong>of</strong> the <strong>Emissions</strong> Calculator had not been updated to<br />
<strong>in</strong>clude the latest eGRID <strong>in</strong>formation, the ERCOT <strong>NOx</strong> emissions <strong>in</strong>formation was<br />
manually updated <strong>in</strong> this study to reflect the latest eGRID <strong>in</strong>formation perta<strong>in</strong><strong>in</strong>g to<br />
ERCOT-only utilities operat<strong>in</strong>g <strong>in</strong> the eight county HGB region. Note also that a 7%<br />
17 <strong>NOx</strong> emissions produced by the Texas electrical grid are based on the “2007 Annual eGRID (25%)” and<br />
“2007 OSD eGRID (25%)” databases us<strong>in</strong>g protocols consistent with those <strong>of</strong> the TCEQ and EPA.<br />
26


