

NOx Emissions Impacts from Widespread Deployment of CHP in ...
NOx Emissions Impacts from Widespread Deployment of CHP in ...
NOx Emissions Impacts from Widespread Deployment of CHP in ...

You also want an ePaper? Increase the reach of your titles
YUMPU automatically turns print PDFs into web optimized ePapers that Google loves.
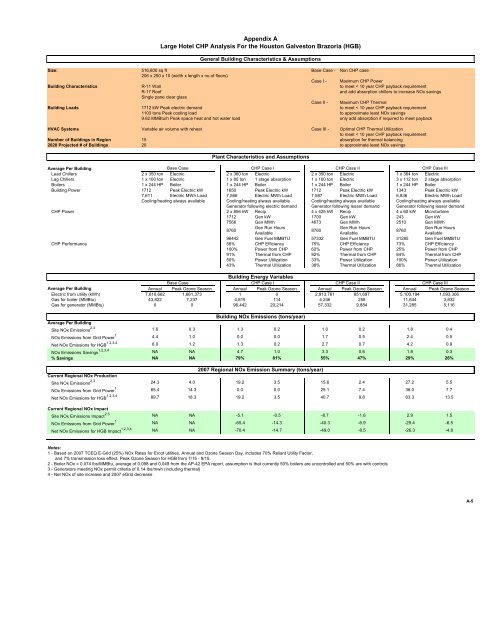
Appendix A<br />
Large Hotel <strong>CHP</strong> Analysis For the Houston Galveston Brazoria (HGB)<br />
General Build<strong>in</strong>g Characteristics & Assumptions<br />
Size: 516,600 sq ft Base Case - Non <strong>CHP</strong> case<br />
206 x 250 x 10 (width x length x no.<strong>of</strong> floors)<br />
Case I - Maximum <strong>CHP</strong> Power<br />
Build<strong>in</strong>g Characteristics R-11 Wall to meet < 10 year <strong>CHP</strong> payback requirement<br />
R-17 Ro<strong>of</strong> and add absorption chillers to <strong>in</strong>crease <strong>NOx</strong> sav<strong>in</strong>gs<br />
S<strong>in</strong>gle pane clear glass<br />
Case II - Maximum <strong>CHP</strong> Thermal<br />
Build<strong>in</strong>g Loads 1712 kW Peak electric demand to meet < 10 year <strong>CHP</strong> payback requirement<br />
1103 tons Peak cool<strong>in</strong>g load to approximate least <strong>NOx</strong> sav<strong>in</strong>gs<br />
9.62 MMBtu/h Peak space heat and hot water load only add absorption if required to meet payback<br />
HVAC Systems Variable air volume with reheat Case III - Optimal <strong>CHP</strong> Thermal Utilization<br />
to meet < 10 year <strong>CHP</strong> payback requirement<br />
Number <strong>of</strong> Build<strong>in</strong>gs <strong>in</strong> Region 15 absorption for thermal balanc<strong>in</strong>g<br />
2020 Projected # <strong>of</strong> Build<strong>in</strong>gs 20 to approximate least <strong>NOx</strong> sav<strong>in</strong>gs<br />
Plant Characteristics and Assumptions<br />
Average Per Build<strong>in</strong>g<br />
Base Case <strong>CHP</strong> Case I<br />
<strong>CHP</strong> Case II<br />
<strong>CHP</strong> Case III<br />
Lead Chillers 2 x 350 ton Electric 2 x 360 ton Electric 2 x 350 ton Electric 1 x 364 ton Electric<br />
Lag Chillers 1 x 100 ton Electric 1 x 80 ton 1 stage absorption 1 x 100 ton Electric 3 x 112 ton 2 stage absorption<br />
Boilers 1 x 244 HP Boiler 1 x 244 HP Boiler 1 x 244 HP Boiler 1 x 244 HP Boiler<br />
Build<strong>in</strong>g Power 1712 Peak Electric kW 1650 Peak Electric kW 1712 Peak Electric kW 1343 Peak Electric kW<br />
7,611 Electric MWh Load 7,566 Electric MWh Load 7,587 Electric MWh Load 6,836 Electric MWh Load<br />
Cool<strong>in</strong>g/heat<strong>in</strong>g always available Cool<strong>in</strong>g/heat<strong>in</strong>g always available Cool<strong>in</strong>g/heat<strong>in</strong>g always available Cool<strong>in</strong>g/heat<strong>in</strong>g always available<br />
Generator follow<strong>in</strong>g electric demand Generator follow<strong>in</strong>g lesser demand Generator follow<strong>in</strong>g lesser demand<br />
<strong>CHP</strong> Power 2 x 856 kW Recip 4 x 425 kW Recip 4 x 60 kW Microturb<strong>in</strong>e<br />
1712 Gen kW 1700 Gen kW 243 Gen kW<br />
7566 Gen MWh 4673 Gen MWh 2510 Gen MWh<br />
8760<br />
Gen Run Hours<br />
Available<br />
8760<br />
Gen Run Hours<br />
Available<br />
8760<br />
Gen Run Hours<br />
Available<br />
96442 Gen Fuel MMBTU 57332 Gen Fuel MMBTU 31285 Gen Fuel MMBTU<br />
<strong>CHP</strong> Performance 56% <strong>CHP</strong> Efficiency 75% <strong>CHP</strong> Efficiency 73% <strong>CHP</strong> Efficiency<br />
100% Power <strong>from</strong> <strong>CHP</strong> 62% Power <strong>from</strong> <strong>CHP</strong> 25% Power <strong>from</strong> <strong>CHP</strong><br />
91% Thermal <strong>from</strong> <strong>CHP</strong> 92% Thermal <strong>from</strong> <strong>CHP</strong> 84% Thermal <strong>from</strong> <strong>CHP</strong><br />
50% Power Utilization 33% Power Utilization 100% Power Utilization<br />
43% Thermal Utilization 38% Thermal Utilization 86% Thermal Utilization<br />
Base Case<br />
Build<strong>in</strong>g Energy Variables<br />
<strong>CHP</strong> Case I<br />
<strong>CHP</strong> Case II<br />
<strong>CHP</strong> Case III<br />
Average Per Build<strong>in</strong>g Annual Peak Ozone Season Annual Peak Ozone Season Annual Peak Ozone Season Annual Peak Ozone Season<br />
Electric <strong>from</strong> utility (kWh) 7,610,662 1,661,373 1 0 2,913,761 851,697 5,100,194 1,093,306<br />
Gas for boiler (MMBtu) 43 43,822 822 77,237 237 44,819 819 114 44,246 246 258 11 11,644 644 33,832 832<br />
Gas for generator (MMBtu) 0 0 96,442 20,214 57,332 9,884 31,285 5,116<br />
Average Per Build<strong>in</strong>g<br />
Site <strong>NOx</strong> <strong>Emissions</strong> 2,3 1.6 0.3 1.3 0.2 1.0 0.2 1.8 0.4<br />
<strong>NOx</strong> <strong>Emissions</strong> <strong>from</strong> Grid Power 1 4.4 1.0 0.0 0.0 1.7 0.5 2.4 0.5<br />
Net <strong>NOx</strong> <strong>Emissions</strong> for HGB 1,2,3,4 6.0 1.2 1.3 0.2 2.7 0.7 4.2 0.9<br />
<strong>NOx</strong> <strong>Emissions</strong> Sav<strong>in</strong>gs 1,2,3,4 Build<strong>in</strong>g <strong>NOx</strong> <strong>Emissions</strong> (tons/year)<br />
NA NA 4.7 1.0 3.3 0.6 1.8 0.3<br />
% Sav<strong>in</strong>gs NA NA 79% 81% 55% 47% 29% 26%<br />
Current Regional <strong>NOx</strong> Production<br />
Site <strong>NOx</strong> <strong>Emissions</strong> 2,3 24.3 4.0 19.2 3.5 15.6 2.4 27.2 5.5<br />
<strong>NOx</strong> <strong>Emissions</strong> <strong>from</strong> Grid Power 1 65.4 14.3 0.0 0.0 25.1 7.4 36.0 7.7<br />
Net <strong>NOx</strong> <strong>Emissions</strong> for HGB 1,2,3,4 Current Regional <strong>NOx</strong> Impact<br />
89.7 18.3 19.2 3.5 40.7 9.8 63.3 13.5<br />
Site <strong>NOx</strong> <strong>Emissions</strong> Impact 2,3 NA NA -5.1 -0.5 -8.7 -1.6 2.9 1.5<br />
<strong>NOx</strong> <strong>Emissions</strong> <strong>from</strong> Grid Power 1 NA NA -65.4 -14.3 -40.3 -6.9 -29.4 -6.5<br />
Net <strong>NOx</strong> <strong>Emissions</strong> for HGB Impact 1,2,3,4 2007 Regional <strong>NOx</strong> Emission Summary (tons/year)<br />
NA NA -70.4 -14.7 -49.0 -8.5 -26.3 -4.8<br />
Notes:<br />
1 - Based on 2007 TCEQ E-Grid (25%) <strong>NOx</strong> Rates for Ercot utilities, Annual and Ozone Season Day, <strong>in</strong>cludes 70% Reliant Utility Factor,<br />
and 7% transmission loss effect. Peak Ozone Season for HGB <strong>from</strong> 7/15 - 9/15.<br />
2 - Boiler <strong>NOx</strong> = 0.074 lbs/MMBtu, average <strong>of</strong> 0.098 and 0.049 <strong>from</strong> the AP-42 EPA report, assumption is that currently 50% boilers are uncontrolled and 50% are with controls<br />
3 - Generators meet<strong>in</strong>g <strong>NOx</strong> permit criteria <strong>of</strong> 0.14 lbs/mwh (<strong>in</strong>clud<strong>in</strong>g thermal)<br />
4 - Net <strong>NOx</strong> <strong>of</strong> site <strong>in</strong>crease and 2007 eGrid decrease<br />
A-5


