NOx Emissions Impacts from Widespread Deployment of CHP in ...
NOx Emissions Impacts from Widespread Deployment of CHP in ...
NOx Emissions Impacts from Widespread Deployment of CHP in ...
Create successful ePaper yourself
Turn your PDF publications into a flip-book with our unique Google optimized e-Paper software.
<strong>NOx</strong> <strong>Emissions</strong> Report<br />
4.1 Geographic Implications<br />
Even though widespread <strong>CHP</strong> implementation across HGB would produce a substantial<br />
net reduction <strong>in</strong> <strong>NOx</strong> emissions, implementation <strong>of</strong> <strong>CHP</strong> system at commercial and<br />
<strong>in</strong>dustrial facilities <strong>in</strong> HGB would relocate the source <strong>of</strong> some <strong>of</strong> those emissions <strong>from</strong><br />
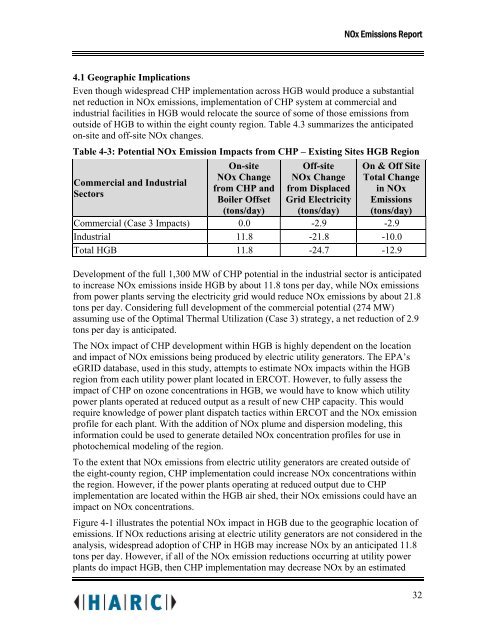
outside <strong>of</strong> HGB to with<strong>in</strong> the eight county region. Table 4.3 summarizes the anticipated<br />
on-site and <strong>of</strong>f-site <strong>NOx</strong> changes.<br />
Table 4-3: Potential <strong>NOx</strong> Emission <strong>Impacts</strong> <strong>from</strong> <strong>CHP</strong> – Exist<strong>in</strong>g Sites HGB Region<br />
Commercial and Industrial<br />
Sectors<br />
On-site<br />
<strong>NOx</strong> Change<br />
<strong>from</strong> <strong>CHP</strong> and<br />
Boiler Offset<br />
(tons/day)<br />
Off-site<br />
<strong>NOx</strong> Change<br />
<strong>from</strong> Displaced<br />
Grid Electricity<br />
(tons/day)<br />
On & Off Site<br />
Total Change<br />
<strong>in</strong> <strong>NOx</strong><br />
<strong>Emissions</strong><br />
(tons/day)<br />
Commercial (Case 3 <strong>Impacts</strong>) 0.0 -2.9 -2.9<br />
Industrial 11.8 -21.8 -10.0<br />
Total HGB 11.8 -24.7 -12.9<br />
Development <strong>of</strong> the full 1,300 MW <strong>of</strong> <strong>CHP</strong> potential <strong>in</strong> the <strong>in</strong>dustrial sector is anticipated<br />
to <strong>in</strong>crease <strong>NOx</strong> emissions <strong>in</strong>side HGB by about 11.8 tons per day, while <strong>NOx</strong> emissions<br />
<strong>from</strong> power plants serv<strong>in</strong>g the electricity grid would reduce <strong>NOx</strong> emissions by about 21.8<br />
tons per day. Consider<strong>in</strong>g full development <strong>of</strong> the commercial potential (274 MW)<br />
assum<strong>in</strong>g use <strong>of</strong> the Optimal Thermal Utilization (Case 3) strategy, a net reduction <strong>of</strong> 2.9<br />
tons per day is anticipated.<br />
The <strong>NOx</strong> impact <strong>of</strong> <strong>CHP</strong> development with<strong>in</strong> HGB is highly dependent on the location<br />
and impact <strong>of</strong> <strong>NOx</strong> emissions be<strong>in</strong>g produced by electric utility generators. The EPA’s<br />
eGRID database, used <strong>in</strong> this study, attempts to estimate <strong>NOx</strong> impacts with<strong>in</strong> the HGB<br />
region <strong>from</strong> each utility power plant located <strong>in</strong> ERCOT. However, to fully assess the<br />
impact <strong>of</strong> <strong>CHP</strong> on ozone concentrations <strong>in</strong> HGB, we would have to know which utility<br />
power plants operated at reduced output as a result <strong>of</strong> new <strong>CHP</strong> capacity. This would<br />
require knowledge <strong>of</strong> power plant dispatch tactics with<strong>in</strong> ERCOT and the <strong>NOx</strong> emission<br />
pr<strong>of</strong>ile for each plant. With the addition <strong>of</strong> <strong>NOx</strong> plume and dispersion model<strong>in</strong>g, this<br />
<strong>in</strong>formation could be used to generate detailed <strong>NOx</strong> concentration pr<strong>of</strong>iles for use <strong>in</strong><br />
photochemical model<strong>in</strong>g <strong>of</strong> the region.<br />
To the extent that <strong>NOx</strong> emissions <strong>from</strong> electric utility generators are created outside <strong>of</strong><br />
the eight-county region, <strong>CHP</strong> implementation could <strong>in</strong>crease <strong>NOx</strong> concentrations with<strong>in</strong><br />
the region. However, if the power plants operat<strong>in</strong>g at reduced output due to <strong>CHP</strong><br />
implementation are located with<strong>in</strong> the HGB air shed, their <strong>NOx</strong> emissions could have an<br />
impact on <strong>NOx</strong> concentrations.<br />
Figure 4-1 illustrates the potential <strong>NOx</strong> impact <strong>in</strong> HGB due to the geographic location <strong>of</strong><br />
emissions. If <strong>NOx</strong> reductions aris<strong>in</strong>g at electric utility generators are not considered <strong>in</strong> the<br />
analysis, widespread adoption <strong>of</strong> <strong>CHP</strong> <strong>in</strong> HGB may <strong>in</strong>crease <strong>NOx</strong> by an anticipated 11.8<br />
tons per day. However, if all <strong>of</strong> the <strong>NOx</strong> emission reductions occurr<strong>in</strong>g at utility power<br />
plants do impact HGB, then <strong>CHP</strong> implementation may decrease <strong>NOx</strong> by an estimated<br />
32


