

NOx Emissions Impacts from Widespread Deployment of CHP in ...
NOx Emissions Impacts from Widespread Deployment of CHP in ...
NOx Emissions Impacts from Widespread Deployment of CHP in ...

You also want an ePaper? Increase the reach of your titles
YUMPU automatically turns print PDFs into web optimized ePapers that Google loves.
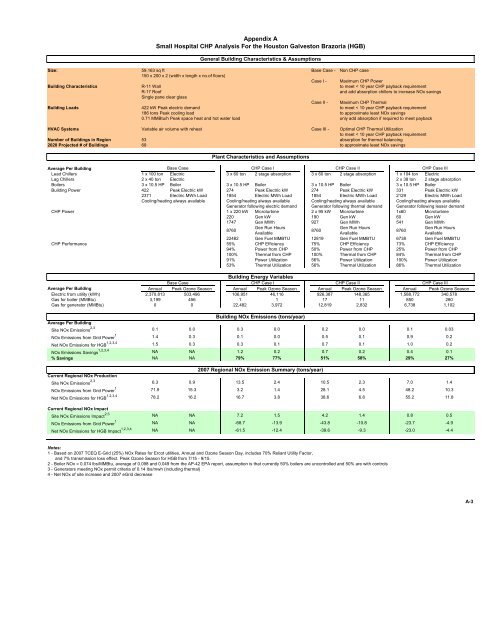
Appendix A<br />
Small Hospital <strong>CHP</strong> Analysis For the Houston Galveston Brazoria (HGB)<br />
General Build<strong>in</strong>g Characteristics & Assumptions<br />
Size: 59,163 sq ft Base Case - Non <strong>CHP</strong> case<br />
150 x 200 x 2 (width x length x no.<strong>of</strong> floors)<br />
Case I - Maximum <strong>CHP</strong> Power<br />
Build<strong>in</strong>g Characteristics R-11 Wall to meet < 10 year <strong>CHP</strong> payback requirement<br />
R-17 Ro<strong>of</strong> and add absorption chillers to <strong>in</strong>crease <strong>NOx</strong> sav<strong>in</strong>gs<br />
S<strong>in</strong>gle pane clear glass<br />
Case II - Maximum <strong>CHP</strong> Thermal<br />
Build<strong>in</strong>g Loads 422 kW Peak electric demand to meet < 10 year <strong>CHP</strong> payback requirement<br />
186 tons Peak cool<strong>in</strong>g load to approximate least <strong>NOx</strong> sav<strong>in</strong>gs<br />
0.71 MMBtu/h Peak space heat and hot water load only add absorption if required to meet payback<br />
HVAC Systems Variable air volume with reheat Case III - Optimal <strong>CHP</strong> Thermal Utilization<br />
to meet < 10 year <strong>CHP</strong> payback requirement<br />
Number <strong>of</strong> Build<strong>in</strong>gs <strong>in</strong> Region 53 absorption for thermal balanc<strong>in</strong>g<br />
2020 Projected # <strong>of</strong> Build<strong>in</strong>gs 69 to approximate least <strong>NOx</strong> sav<strong>in</strong>gs<br />
Plant Characteristics and Assumptions<br />
Average Per Build<strong>in</strong>g<br />
Base Case <strong>CHP</strong> Case I <strong>CHP</strong> Case II<br />
<strong>CHP</strong> Case III<br />
Lead Chillers 1 x 100 ton Electric 3 x 60 ton 2 stage absorption 3 x 60 ton 2 stage absorption 1 x 10⁴ ton Electric<br />
Lag Chillers 2 x 40 ton Electric 2 x 38 ton 2 stage absorption<br />
Boilers 3 x 10.5 HP Boiler 3 x 10.5 HP Boiler 3 x 10.5 HP Boiler 3 x 10.5 HP Boiler<br />
Build<strong>in</strong>g Power 422 Peak Electric kW 274 Peak Electric kW 274 Peak Electric kW 331 Peak Electric kW<br />
2371 Electric MWh Load 1854 Electric MWh Load 1854 Electric MWh Load 2129 Electric MWh Load<br />
Cool<strong>in</strong>g/heat<strong>in</strong>g always available Cool<strong>in</strong>g/heat<strong>in</strong>g always available Cool<strong>in</strong>g/heat<strong>in</strong>g always available Cool<strong>in</strong>g/heat<strong>in</strong>g always available<br />
Generator follow<strong>in</strong>g electric demand Generator follow<strong>in</strong>g thermal demand Generator follow<strong>in</strong>g lesser demand<br />
<strong>CHP</strong> Power 1 x 220 kW Microturb<strong>in</strong>e 2 x 95 kW Microturb<strong>in</strong>e 1x60 Microturb<strong>in</strong>e<br />
220 Gen kW 190 Gen kW 60 Gen kW<br />
1747 Gen MWh 927 Gen MWh 541 Gen MWh<br />
8760<br />
Gen Run Hours<br />
Available<br />
8760<br />
Gen Run Hours<br />
Available<br />
8760<br />
Gen Run Hours<br />
Available<br />
22482 Gen Fuel MMBTU 12819 Gen Fuel MMBTU 6738 Gen Fuel MMBTU<br />
<strong>CHP</strong> Performance 55% <strong>CHP</strong> Efficiency 75% <strong>CHP</strong> Efficiency 73% <strong>CHP</strong> Efficiency<br />
94% Power <strong>from</strong> <strong>CHP</strong> 50% Power <strong>from</strong> <strong>CHP</strong> 25% Power <strong>from</strong> <strong>CHP</strong><br />
100% Thermal <strong>from</strong> <strong>CHP</strong> 100% Thermal <strong>from</strong> <strong>CHP</strong> 84% Thermal <strong>from</strong> <strong>CHP</strong><br />
91% Power Utilization 56% Power Utilization 100% Power Utilization<br />
53% Thermal Utilization 56% Thermal Utilization 86% Thermal Utilization<br />
Base Case<br />
Build<strong>in</strong>g Energy Variables<br />
<strong>CHP</strong> Case I<br />
<strong>CHP</strong> Case II<br />
<strong>CHP</strong> Case III<br />
Average Per Build<strong>in</strong>g Annual Peak Ozone Season Annual Peak Ozone Season Annual Peak Ozone Season Annual Peak Ozone Season<br />
Electric <strong>from</strong> utility (kWh) 2,370,813 503,496 106,951 46,116 926,387 148,365 1,588,772 340,578<br />
Gas for boiler (MMBtu) 33,199 199 456 1 1 17 11 850 280<br />
Gas for generator (MMBtu) 0 0 22,482 3,972 12,819 2,832 6,738 1,102<br />
Average Per Build<strong>in</strong>g<br />
Site <strong>NOx</strong> <strong>Emissions</strong> 2,3 0.1 0.0 0.3 0.0 0.2 0.0 0.1 0.03<br />
<strong>NOx</strong> <strong>Emissions</strong> <strong>from</strong> Grid Power 1 1.4 0.3 0.1 0.0 0.5 0.1 0.9 0.2<br />
Net <strong>NOx</strong> <strong>Emissions</strong> for HGB 1,2,3,4 1.5 0.3 0.3 0.1 0.7 0.1 1.0 0.2<br />
<strong>NOx</strong> <strong>Emissions</strong> Sav<strong>in</strong>gs 1,2,3,4 Build<strong>in</strong>g <strong>NOx</strong> <strong>Emissions</strong> (tons/year)<br />
NA NA 1.2 0.2 0.7 0.2 0.4 0.1<br />
% Sav<strong>in</strong>gs NA NA 79% 77% 51% 58% 29% 27%<br />
Current Regional <strong>NOx</strong> Production<br />
Site <strong>NOx</strong> <strong>Emissions</strong> 2,3 6.3 0.9 13.5 2.4 10.5 2.3 7.0 1.4<br />
<strong>NOx</strong> <strong>Emissions</strong> <strong>from</strong> Grid Power 1 71.9 15.3 3.2 1.4 28.1 4.5 48.2 10.3<br />
Net <strong>NOx</strong> <strong>Emissions</strong> for HGB 1,2,3,4 Current Regional <strong>NOx</strong> Impact<br />
78.2 16.2 16.7 3.8 38.6 6.8 55.2 11.8<br />
Site <strong>NOx</strong> <strong>Emissions</strong> Impact 2,3 NA NA 7.2 1.5 4.2 1.4 0.8 0.5<br />
<strong>NOx</strong> <strong>Emissions</strong> <strong>from</strong> Grid Power 1 NA NA -68.7 -13.9 -43.8 -10.8 -23.7 -4.9<br />
Net <strong>NOx</strong> <strong>Emissions</strong> for HGB Impact 1,2,3,4 2007 Regional <strong>NOx</strong> Emission Summary (tons/year)<br />
NA NA -61.5 -12.4 -39.6 -9.3 -23.0 -4.4<br />
Notes:<br />
1 - Based on 2007 TCEQ E-Grid (25%) <strong>NOx</strong> Rates for Ercot utilities, Annual and Ozone Season Day, <strong>in</strong>cludes 70% Reliant Utility Factor,<br />
and 7% transmission loss effect. Peak Ozone Season for HGB <strong>from</strong> 7/15 - 9/15.<br />
2 - Boiler <strong>NOx</strong> = 0.074 lbs/MMBtu, average <strong>of</strong> 0.098 and 0.049 <strong>from</strong> the AP-42 EPA report, assumption is that currently 50% boilers are uncontrolled and 50% are with controls<br />
3 - Generators meet<strong>in</strong>g <strong>NOx</strong> permit criteria <strong>of</strong> 0.14 lbs/mwh (<strong>in</strong>clud<strong>in</strong>g thermal)<br />
4 - Net <strong>NOx</strong> <strong>of</strong> site <strong>in</strong>crease and 2007 eGrid decrease<br />
A-3


