PDF (tesi dottorato ROTIROTI) - FedOA - Università degli Studi di ...
PDF (tesi dottorato ROTIROTI) - FedOA - Università degli Studi di ...
PDF (tesi dottorato ROTIROTI) - FedOA - Università degli Studi di ...

You also want an ePaper? Increase the reach of your titles
YUMPU automatically turns print PDFs into web optimized ePapers that Google loves.
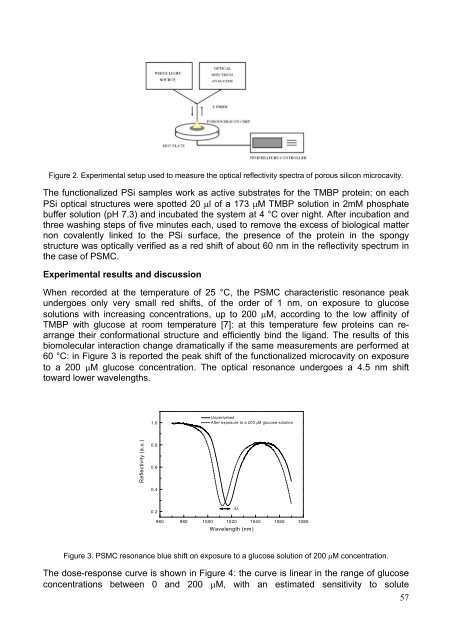
Figure 2. Experimental setup used to measure the optical reflectivity spectra of porous silicon microcavity.<br />
The functionalized PSi samples work as active substrates for the TMBP protein: on each<br />
PSi optical structures were spotted 20 μl of a 173 μM TMBP solution in 2mM phosphate<br />
buffer solution (pH 7.3) and incubated the system at 4 °C over night. After incubation and<br />
three washing steps of five minutes each, used to remove the excess of biological matter<br />
non covalently linked to the PSi surface, the presence of the protein in the spongy<br />
structure was optically verified as a red shift of about 60 nm in the reflectivity spectrum in<br />
the case of PSMC.<br />
Experimental results and <strong>di</strong>scussion<br />
When recorded at the temperature of 25 °C, the PSMC characteristic resonance peak<br />
undergoes only very small red shifts, of the order of 1 nm, on exposure to glucose<br />
solutions with increasing concentrations, up to 200 μM, accor<strong>di</strong>ng to the low affinity of<br />
TMBP with glucose at room temperature [7]: at this temperature few proteins can rearrange<br />
their conformational structure and efficiently bind the ligand. The results of this<br />
biomolecular interaction change dramatically if the same measurements are performed at<br />
60 °C: in Figure 3 is reported the peak shift of the functionalized microcavity on exposure<br />
to a 200 μM glucose concentration. The optical resonance undergoes a 4.5 nm shift<br />
toward lower wavelengths.<br />
Reflectivity (a.u.)<br />
1.0<br />
0.8<br />
0.6<br />
0.4<br />
0.2<br />
Unperturbed<br />
After exposure to a 200 μM glucose solution<br />
960 980 1000 1020 1040 1060 1080<br />
Δλ<br />
Wavelength (nm)<br />
Figure 3. PSMC resonance blue shift on exposure to a glucose solution of 200 μM concentration.<br />
The dose-response curve is shown in Figure 4: the curve is linear in the range of glucose<br />
concentrations between 0 and 200 μM, with an estimated sensitivity to solute<br />
57