Social and Community Infrastructure Assessment - Growth Areas ...
Social and Community Infrastructure Assessment - Growth Areas ...
Social and Community Infrastructure Assessment - Growth Areas ...

You also want an ePaper? Increase the reach of your titles
YUMPU automatically turns print PDFs into web optimized ePapers that Google loves.
Wollert/Quarry Hills <strong>Social</strong> <strong>and</strong> <strong>Community</strong> <strong>Infrastructure</strong> <strong>Assessment</strong><br />
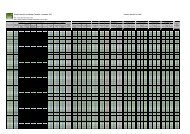
Appendix D – Population projections by single years age cohorts<br />
Age Population numbers by area<br />
Years Quarry Hills Wollert 1 Wollert 2 Wollert 3 Epping North-Wollert<br />
Whittlesea <strong>Growth</strong> Whittlesea<br />
3<br />
Sub-region<br />
municipality<br />
0 83 346 457 554 1260 3471 4153 7399<br />
1 81 336 443 537 1222 3369 4030 7181<br />
2 79 329 434 527 1198 3301 3949 7036<br />
3 77 322 425 516 1173 3232 3867 6891<br />
4 76 317 418 507 1153 3176 3799 6770<br />
5 72 302 399 483 1099 3028 3623 6456<br />
6 70 293 387 469 1066 2938 3515 6263<br />
7 68 285 376 456 1037 2858 3419 6093<br />
8 67 279 369 447 1017 2801 3352 5972<br />
9 66 275 363 440 1000 2756 3297 5876<br />
10 65 270 357 432 984 2711 3243 5779<br />
11 64 267 352 427 971 2677 3203 5706<br />
12 64 265 349 423 963 2654 3175 5658<br />
13 64 265 349 423 963 2654 3175 5658<br />
14 63 261 345 418 951 2620 3134 5586<br />
15 63 262 346 420 955 2631 3148 5610<br />
16 63 263 348 422 959 2643 3161 5634<br />
17 67 279 369 447 1017 2801 3352 5972<br />
18 70 292 385 467 1062 2926 3501 6238<br />
19 70 293 387 469 1066 2938 3515 6263<br />
20 78 325 428 519 1181 3255 3895 6940<br />
21 84 348 460 557 1268 3493 4180 7447<br />
22 86 360 475 575 1309 3607 4315 7689<br />
23 92 382 505 612 1391 3834 4586 8173<br />
24 93 389 513 622 1416 3902 4668 8318<br />
25 98 409 540 655 1490 4106 4912 8753<br />
26 99 413 545 660 1502 4140 4953 8826<br />
27 98 407 537 651 1482 4083 4885 8705<br />
28 99 412 543 659 1498 4129 4939 8801<br />
29 97 405 534 648 1474 4060 4858 8656<br />
30 96 401 530 642 1461 4026 4817 8584<br />
31 95 397 524 635 1445 3981 4763 8487<br />
32 93 389 513 622 1416 3902 4668 8318<br />
33 91 381 503 610 1387 3822 4573 8149<br />
34 90 374 494 599 1362 3754 4492 8004<br />
35 86 358 473 574 1305 3595 4301 7665<br />
36 84 352 464 563 1280 3527 4220 7520<br />
37 82 340 449 545 1239 3414 4084 7278<br />
38 80 334 440 534 1214 3346 4003 7133<br />
39 79 328 433 525 1194 3289 3935 7012<br />
40 74 309 407 494 1124 3096 3705 6601<br />
41 72 299 394 478 1087 2994 3582 6384<br />
42 68 284 375 454 1033 2847 3406 6069<br />
43 69 286 378 458 1041 2870 3434 6118<br />
51<br />
Northern Melbourne<br />
<strong>Growth</strong> Region