Social and Community Infrastructure Assessment - Growth Areas ...
Social and Community Infrastructure Assessment - Growth Areas ...
Social and Community Infrastructure Assessment - Growth Areas ...

You also want an ePaper? Increase the reach of your titles
YUMPU automatically turns print PDFs into web optimized ePapers that Google loves.
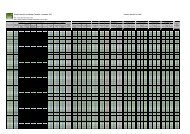
Wollert/Quarry Hills <strong>Social</strong> <strong>and</strong> <strong>Community</strong> <strong>Infrastructure</strong> <strong>Assessment</strong><br />
<strong>Community</strong> <strong>Infrastructure</strong> Category Provision Ratio Source Quarry Hills Wollert 1 Wollert 2 Wollert 3 Epping Nth,<br />
Quarry Hills<br />
Wollert 1<br />
Health Services<br />
Public <strong>and</strong> private hospital bed 3.8 beds per 1000 people AIHW, 2010. Australian hospital statistics 2008–09.<br />
AIHW cat. No. HSE 84<br />
Public hospital bed 2.3 beds per 1000 people AIHW, 2010. Australian hospital statistics 2008–09.<br />
AIHW cat. No. HSE 84<br />
<strong>Community</strong> health service/GP super-clinic 1site per 60,000 people<br />
Planning for CI In <strong>Growth</strong> Area Communities: St<strong>and</strong>ards<br />
Project (April 2008)<br />
Draft GAA Heath <strong>and</strong> Aged Care benchmarks<br />
Acute hospital<br />
Housing<br />
1 hospital per 500,000 people Draft Corridor Plan: Melbourne North<br />
Draft GAA Heath <strong>and</strong> Aged Care benchmarks<br />
Affordable housing 10% of dwellings COW <strong>Social</strong> <strong>and</strong> Affordable Housing Policy <strong>and</strong> Strategy<br />
2012-2016<br />
<strong>Social</strong> housing<br />
Residential Aged Care & HACC<br />
5% of dwellings COW <strong>Social</strong> <strong>and</strong> Affordable Housing Policy <strong>and</strong> Strategy<br />
2012-2016<br />
56<br />
Epping Nth,<br />
Quarry Hills<br />
Wollert 2<br />
Epping Nth,<br />
Quarry Hills<br />
Wollert 3<br />
6,000 25,000 33,000 40,000 76,000 84,000 91,000<br />
23 95 125 152 289 319 346<br />
14 58 76 92 175 193 209<br />
0.1 0.4 0.6 0.7 1.3 1.4 1.5<br />
0.01 0.05 0.07 0.08 0.15 0.17 0.18<br />
214 893 1179 1429 2714 3000 3250<br />
107 446 589 714 1357 1500 1625<br />
High care bed 44 beds per 1000 people aged 70<br />
years +<br />
Australian Government Planning Ratio (2007) 33 137 181 220 417 461 500<br />
Low care bed 44 beds per 1000 people aged 70<br />
years +<br />
Australian Government Planning Ratio (2007) 33 137 181 220 417 461 500<br />
Independent living village (100 unit) 1 village: 1270 people aged 65+ Actual provision rate in Australia in 2012 1 4 5 6 11 13 14<br />
<strong>Community</strong> aged care package 25 beds per 1000 people aged 70<br />
years +<br />
People receiving HACC services 4.9% of total population receiving<br />
services at any time in 12 months<br />
(Victoria)%<br />
People 70 Years <strong>and</strong> over receiving HACC 33.4% of people aged 70 Years<br />
services<br />
<strong>and</strong> over<br />
Australian Government Planning Ratio (2007) 19 78 103 125 237 262 284<br />
Federal Dept of Health <strong>and</strong> Ageing (2009-2010), Ageing<br />
<strong>and</strong> Aged Care: Key Stats<br />
Federal Dept of Health <strong>and</strong> Ageing (2009-2010), Ageing<br />
<strong>and</strong> Aged Care: Key Stats<br />
294 1225 1617 1960 3724 4116 4459<br />
250 1042 1375 1667 3167 3500 3792