Community-based Sectors for the New England Groundfish Fishery
Community-based Sectors for the New England Groundfish Fishery
Community-based Sectors for the New England Groundfish Fishery

Create successful ePaper yourself
Turn your PDF publications into a flip-book with our unique Google optimized e-Paper software.
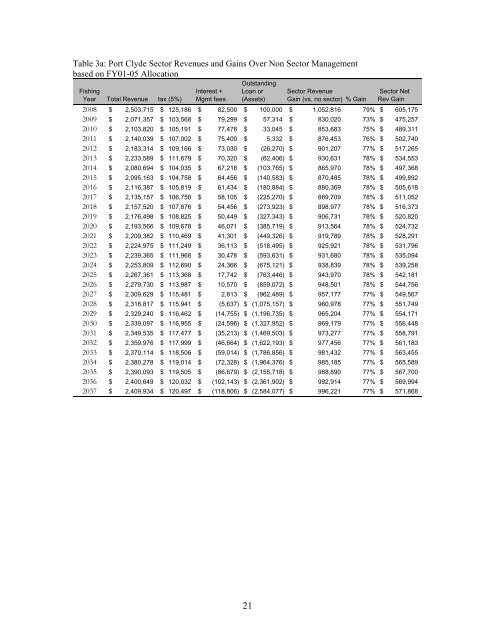
Table 3a: Port Clyde Sector Revenues and Gains Over Non Sector Management<br />
<strong>based</strong> on FY01-05 Allocation<br />
Fishing<br />
Year Total Revenue tax (5%)<br />
Interest +<br />
Mgmt fees<br />
Outstanding<br />
Loan or<br />
(Assets)<br />
Sector Revenue<br />
Gain (vs. no sector) % Gain<br />
Sector Net<br />
Rev Gain<br />
2008 $ 2,503,715 $ 125,186 $ 82,500 $ 100,000 $ 1,052,816 79% $ 605,175<br />
2009 $ 2,071,357 $ 103,568 $ 79,299 $ 57,314 $ 830,020 73% $ 475,257<br />
2010 $ 2,103,820 $ 105,191 $ 77,478 $ 33,045 $ 853,683 75% $ 489,311<br />
2011 $ 2,140,039 $ 107,002 $ 75,400 $ 5,332 $ 876,453 76% $ 502,740<br />
2012 $ 2,183,314 $ 109,166 $ 73,030 $ (26,270) $ 901,207 77% $ 517,265<br />
2013 $ 2,233,589 $ 111,679 $ 70,320 $ (62,406) $ 930,631 78% $ 534,553<br />
2014 $ 2,080,694 $ 104,035 $ 67,218 $ (103,765) $ 865,970 78% $ 497,368<br />
2015 $ 2,095,163 $ 104,758 $ 64,456 $ (140,583) $ 870,485 78% $ 499,892<br />
2016 $ 2,116,387 $ 105,819 $ 61,434 $ (180,884) $ 880,369 78% $ 505,618<br />
2017 $ 2,135,157 $ 106,758 $ 58,105 $ (225,270) $ 889,709 78% $ 511,052<br />
2018 $ 2,157,520 $ 107,876 $ 54,456 $ (273,923) $ 898,977 78% $ 516,373<br />
2019 $ 2,176,498 $ 108,825 $ 50,449 $ (327,343) $ 906,731 78% $ 520,820<br />
2020 $ 2,193,566 $ 109,678 $ 46,071 $ (385,719) $ 913,564 78% $ 524,732<br />
2021 $ 2,209,382 $ 110,469 $ 41,301 $ (449,326) $ 919,789 78% $ 528,291<br />
2022 $ 2,224,975 $ 111,249 $ 36,113 $ (518,495) $ 925,921 78% $ 531,796<br />
2023 $ 2,239,365 $ 111,968 $ 30,478 $ (593,631) $ 931,680 78% $ 535,094<br />
2024 $ 2,253,809 $ 112,690 $ 24,366 $ (675,121) $ 938,839 78% $ 539,258<br />
2025 $ 2,267,361 $ 113,368 $ 17,742 $ (763,446) $ 943,970 78% $ 542,181<br />
2026 $ 2,279,730 $ 113,987 $ 10,570 $ (859,072) $ 948,501 78% $ 544,756<br />
2027 $ 2,309,629 $ 115,481 $ 2,813 $ (962,489) $ 957,177 77% $ 549,567<br />
2028 $ 2,318,817 $ 115,941 $ (5,637) $ (1,075,157) $ 960,978 77% $ 551,749<br />
2029 $ 2,329,240 $ 116,462 $ (14,755) $ (1,196,735) $ 965,204 77% $ 554,171<br />
2030 $ 2,339,097 $ 116,955 $ (24,596) $ (1,327,952) $ 969,179 77% $ 556,448<br />
2031 $ 2,349,535 $ 117,477 $ (35,213) $ (1,469,503) $ 973,277 77% $ 558,791<br />
2032 $ 2,359,976 $ 117,999 $ (46,664) $ (1,622,193) $ 977,456 77% $ 561,183<br />
2033 $ 2,370,114 $ 118,506 $ (59,014) $ (1,786,856) $ 981,432 77% $ 563,455<br />
2034 $ 2,380,278 $ 119,014 $ (72,328) $ (1,964,376) $ 985,185 77% $ 565,589<br />
2035 $ 2,390,093 $ 119,505 $ (86,679) $ (2,155,718) $ 988,890 77% $ 567,700<br />
2036 $ 2,400,649 $ 120,032 $ (102,143) $ (2,361,902) $ 992,914 77% $ 569,994<br />
2037 $ 2,409,934 $ 120,497 $ (118,806) $ (2,584,077) $ 996,221 77% $ 571,868<br />
21