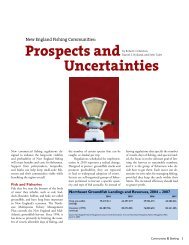
Community-based Sectors for the New England Groundfish Fishery
Community-based Sectors for the New England Groundfish Fishery
Community-based Sectors for the New England Groundfish Fishery

Create successful ePaper yourself
Turn your PDF publications into a flip-book with our unique Google optimized e-Paper software.
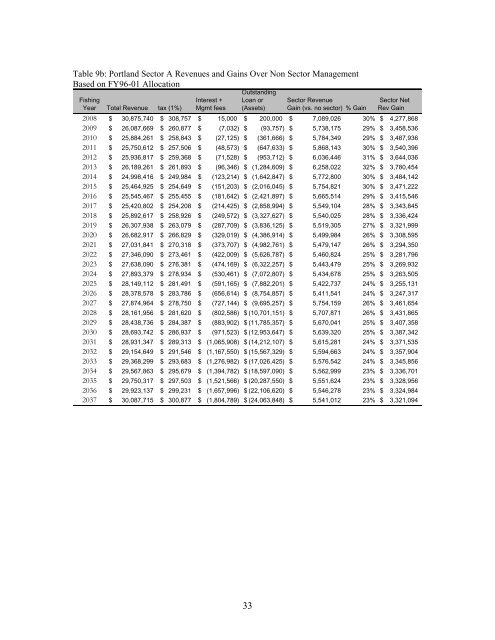
Table 9b: Portland Sector A Revenues and Gains Over Non Sector Management<br />
Based on FY96-01 Allocation<br />
Fishing<br />
Year Total Revenue tax (1%)<br />
Interest +<br />
Mgmt fees<br />
Outstanding<br />
Loan or<br />
(Assets)<br />
Sector Revenue<br />
Gain (vs. no sector) % Gain<br />
Sector Net<br />
Rev Gain<br />
2008 $ 30,875,740 $ 308,757 $ 15,000 $ 200,000 $ 7,089,026 30% $ 4,277,868<br />
2009 $ 26,087,669 $ 260,877 $ (7,032) $ (93,757) $ 5,738,175 29% $ 3,458,536<br />
2010 $ 25,884,261 $ 258,843 $ (27,125) $ (361,666) $ 5,784,349 29% $ 3,487,936<br />
2011 $ 25,750,612 $ 257,506 $ (48,573) $ (647,633) $ 5,868,143 30% $ 3,540,396<br />
2012 $ 25,936,817 $ 259,368 $ (71,528) $ (953,712) $ 6,036,446 31% $ 3,644,036<br />
2013 $ 26,189,261 $ 261,893 $ (96,346) $ (1,284,609) $ 6,258,022 32% $ 3,780,454<br />
2014 $ 24,998,416 $ 249,984 $ (123,214) $ (1,642,847) $ 5,772,800 30% $ 3,484,142<br />
2015 $ 25,464,925 $ 254,649 $ (151,203) $ (2,016,045) $ 5,754,821 30% $ 3,471,222<br />
2016 $ 25,545,467 $ 255,455 $ (181,642) $ (2,421,897) $ 5,665,514 29% $ 3,415,546<br />
2017 $ 25,420,802 $ 254,208 $ (214,425) $ (2,858,994) $ 5,549,104 28% $ 3,343,845<br />
2018 $ 25,892,617 $ 258,926 $ (249,572) $ (3,327,627) $ 5,540,025 28% $ 3,336,424<br />
2019 $ 26,307,938 $ 263,079 $ (287,709) $ (3,836,125) $ 5,519,305 27% $ 3,321,999<br />
2020 $ 26,682,917 $ 266,829 $ (329,019) $ (4,386,914) $ 5,499,984 26% $ 3,308,595<br />
2021 $ 27,031,841 $ 270,318 $ (373,707) $ (4,982,761) $ 5,479,147 26% $ 3,294,350<br />
2022 $ 27,346,090 $ 273,461 $ (422,009) $ (5,626,787) $ 5,460,824 25% $ 3,281,796<br />
2023 $ 27,638,090 $ 276,381 $ (474,169) $ (6,322,257) $ 5,443,479 25% $ 3,269,932<br />
2024 $ 27,893,379 $ 278,934 $ (530,461) $ (7,072,807) $ 5,434,678 25% $ 3,263,505<br />
2025 $ 28,149,112 $ 281,491 $ (591,165) $ (7,882,201) $ 5,422,737 24% $ 3,255,131<br />
2026 $ 28,378,578 $ 283,786 $ (656,614) $ (8,754,857) $ 5,411,541 24% $ 3,247,317<br />
2027 $ 27,874,964 $ 278,750 $ (727,144) $ (9,695,257) $ 5,754,159 26% $ 3,461,654<br />
2028 $ 28,161,956 $ 281,620 $ (802,586) $ (10,701,151) $ 5,707,871 26% $ 3,431,865<br />
2029 $ 28,438,736 $ 284,387 $ (883,902) $ (11,785,357) $ 5,670,041 25% $ 3,407,358<br />
2030 $ 28,693,742 $ 286,937 $ (971,523) $ (12,953,647) $ 5,639,320 25% $ 3,387,342<br />
2031 $ 28,931,347 $ 289,313 $ (1,065,908) $ (14,212,107) $ 5,615,281 24% $ 3,371,535<br />
2032 $ 29,154,649 $ 291,546 $ (1,167,550) $ (15,567,329) $ 5,594,663 24% $ 3,357,904<br />
2033 $ 29,368,299 $ 293,683 $ (1,276,982) $ (17,026,425) $ 5,576,542 24% $ 3,345,856<br />
2034 $ 29,567,863 $ 295,679 $ (1,394,782) $ (18,597,090) $ 5,562,999 23% $ 3,336,701<br />
2035 $ 29,750,317 $ 297,503 $ (1,521,566) $ (20,287,550) $ 5,551,624 23% $ 3,328,956<br />
2036 $ 29,923,137 $ 299,231 $ (1,657,996) $ (22,106,620) $ 5,546,278 23% $ 3,324,984<br />
2037 $ 30,087,715 $ 300,877 $ (1,804,789) $ (24,063,848) $ 5,541,012 23% $ 3,321,094<br />
33