Community-based Sectors for the New England Groundfish Fishery
Community-based Sectors for the New England Groundfish Fishery
Community-based Sectors for the New England Groundfish Fishery

You also want an ePaper? Increase the reach of your titles
YUMPU automatically turns print PDFs into web optimized ePapers that Google loves.
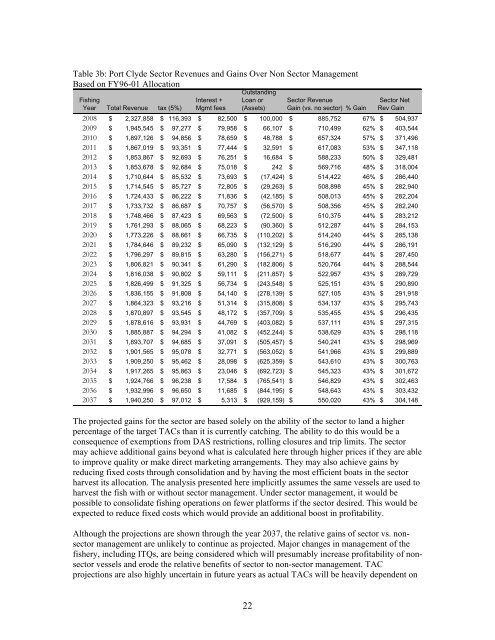
Table 3b: Port Clyde Sector Revenues and Gains Over Non Sector Management<br />
Based on FY96-01 Allocation<br />
Fishing<br />
Year Total Revenue tax (5%)<br />
Interest +<br />
Mgmt fees<br />
Outstanding<br />
Loan or<br />
(Assets)<br />
Sector Revenue<br />
Gain (vs. no sector) % Gain<br />
Sector Net<br />
Rev Gain<br />
2008 $ 2,327,858 $ 116,393 $ 82,500 $ 100,000 $ 885,752 67% $ 504,937<br />
2009 $ 1,945,545 $ 97,277 $ 79,958 $ 66,107 $ 710,499 62% $ 403,544<br />
2010 $ 1,897,126 $ 94,856 $ 78,659 $ 48,788 $ 657,324 57% $ 371,496<br />
2011 $ 1,867,019 $ 93,351 $ 77,444 $ 32,591 $ 617,083 53% $ 347,118<br />
2012 $ 1,853,867 $ 92,693 $ 76,251 $ 16,684 $ 588,233 50% $ 329,481<br />
2013 $ 1,853,678 $ 92,684 $ 75,018 $ 242 $ 569,716 48% $ 318,004<br />
2014 $ 1,710,644 $ 85,532 $ 73,693 $ (17,424) $ 514,422 46% $ 286,440<br />
2015 $ 1,714,545 $ 85,727 $ 72,805 $ (29,263) $ 508,898 45% $ 282,940<br />
2016 $ 1,724,433 $ 86,222 $ 71,836 $ (42,185) $ 508,013 45% $ 282,204<br />
2017 $ 1,733,732 $ 86,687 $ 70,757 $ (56,570) $ 508,356 45% $ 282,240<br />
2018 $ 1,748,466 $ 87,423 $ 69,563 $ (72,500) $ 510,375 44% $ 283,212<br />
2019 $ 1,761,293 $ 88,065 $ 68,223 $ (90,360) $ 512,287 44% $ 284,153<br />
2020 $ 1,773,226 $ 88,661 $ 66,735 $ (110,202) $ 514,240 44% $ 285,138<br />
2021 $ 1,784,646 $ 89,232 $ 65,090 $ (132,129) $ 516,290 44% $ 286,191<br />
2022 $ 1,796,297 $ 89,815 $ 63,280 $ (156,271) $ 518,677 44% $ 287,450<br />
2023 $ 1,806,821 $ 90,341 $ 61,290 $ (182,806) $ 520,764 44% $ 288,544<br />
2024 $ 1,816,038 $ 90,802 $ 59,111 $ (211,857) $ 522,957 43% $ 289,729<br />
2025 $ 1,826,499 $ 91,325 $ 56,734 $ (243,548) $ 525,151 43% $ 290,890<br />
2026 $ 1,836,155 $ 91,808 $ 54,140 $ (278,139) $ 527,105 43% $ 291,918<br />
2027 $ 1,864,323 $ 93,216 $ 51,314 $ (315,808) $ 534,137 43% $ 295,743<br />
2028 $ 1,870,897 $ 93,545 $ 48,172 $ (357,709) $ 535,455 43% $ 296,435<br />
2029 $ 1,878,616 $ 93,931 $ 44,769 $ (403,082) $ 537,111 43% $ 297,315<br />
2030 $ 1,885,887 $ 94,294 $ 41,082 $ (452,244) $ 538,629 43% $ 298,118<br />
2031 $ 1,893,707 $ 94,685 $ 37,091 $ (505,457) $ 540,241 43% $ 298,969<br />
2032 $ 1,901,565 $ 95,078 $ 32,771 $ (563,052) $ 541,966 43% $ 299,889<br />
2033 $ 1,909,250 $ 95,462 $ 28,098 $ (625,359) $ 543,610 43% $ 300,763<br />
2034 $ 1,917,265 $ 95,863 $ 23,046 $ (692,723) $ 545,323 43% $ 301,672<br />
2035 $ 1,924,766 $ 96,238 $ 17,584 $ (765,541) $ 546,829 43% $ 302,463<br />
2036 $ 1,932,996 $ 96,650 $ 11,685 $ (844,195) $ 548,643 43% $ 303,432<br />
2037 $ 1,940,250 $ 97,012 $ 5,313 $ (929,159) $ 550,020 43% $ 304,148<br />
The projected gains <strong>for</strong> <strong>the</strong> sector are <strong>based</strong> solely on <strong>the</strong> ability of <strong>the</strong> sector to land a higher<br />
percentage of <strong>the</strong> target TACs than it is currently catching. The ability to do this would be a<br />
consequence of exemptions from DAS restrictions, rolling closures and trip limits. The sector<br />
may achieve additional gains beyond what is calculated here through higher prices if <strong>the</strong>y are able<br />
to improve quality or make direct marketing arrangements. They may also achieve gains by<br />
reducing fixed costs through consolidation and by having <strong>the</strong> most efficient boats in <strong>the</strong> sector<br />
harvest its allocation. The analysis presented here implicitly assumes <strong>the</strong> same vessels are used to<br />
harvest <strong>the</strong> fish with or without sector management. Under sector management, it would be<br />
possible to consolidate fishing operations on fewer plat<strong>for</strong>ms if <strong>the</strong> sector desired. This would be<br />
expected to reduce fixed costs which would provide an additional boost in profitability.<br />
Although <strong>the</strong> projections are shown through <strong>the</strong> year 2037, <strong>the</strong> relative gains of sector vs. nonsector<br />
management are unlikely to continue as projected. Major changes in management of <strong>the</strong><br />
fishery, including ITQs, are being considered which will presumably increase profitability of nonsector<br />
vessels and erode <strong>the</strong> relative benefits of sector to non-sector management. TAC<br />
projections are also highly uncertain in future years as actual TACs will be heavily dependent on<br />
22