Community-based Sectors for the New England Groundfish Fishery
Community-based Sectors for the New England Groundfish Fishery
Community-based Sectors for the New England Groundfish Fishery

You also want an ePaper? Increase the reach of your titles
YUMPU automatically turns print PDFs into web optimized ePapers that Google loves.
system this problem could be mitigated through quota markets. An individual could simply<br />
purchase additional ACE <strong>for</strong> species <strong>for</strong> which <strong>the</strong>ir ACE allocation is inadequate or <strong>the</strong>y could<br />
sell unused ACE. Internal trades within a sector could accomplish <strong>the</strong> same objective; however,<br />
<strong>the</strong> effective market may be thin, particularly <strong>for</strong> small sectors like <strong>the</strong> Port Clyde sector.<br />
Fur<strong>the</strong>rmore, <strong>for</strong> a geographically constrained sector, <strong>the</strong> species composition across vessels may<br />
not vary that much, and vessels may have less ability to vary <strong>the</strong> composition through spatial or<br />
temporal shifts of ef<strong>for</strong>t. Allowing trading between sectors (assuming more are created) might<br />
alleviate this problem, but current rules do not allow trading between sectors.<br />
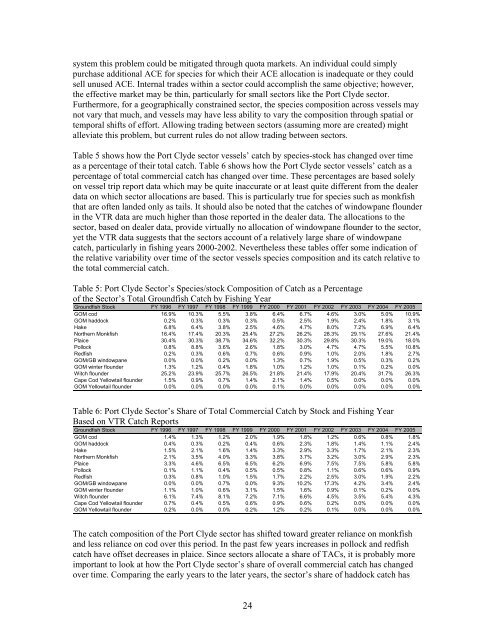
Table 5 shows how <strong>the</strong> Port Clyde sector vessels’ catch by species-stock has changed over time<br />
as a percentage of <strong>the</strong>ir total catch. Table 6 shows how <strong>the</strong> Port Clyde sector vessels’ catch as a<br />
percentage of total commercial catch has changed over time. These percentages are <strong>based</strong> solely<br />
on vessel trip report data which may be quite inaccurate or at least quite different from <strong>the</strong> dealer<br />
data on which sector allocations are <strong>based</strong>. This is particularly true <strong>for</strong> species such as monkfish<br />
that are often landed only as tails. It should also be noted that <strong>the</strong> catches of windowpane flounder<br />
in <strong>the</strong> VTR data are much higher than those reported in <strong>the</strong> dealer data. The allocations to <strong>the</strong><br />
sector, <strong>based</strong> on dealer data, provide virtually no allocation of windowpane flounder to <strong>the</strong> sector,<br />
yet <strong>the</strong> VTR data suggests that <strong>the</strong> sectors account of a relatively large share of windowpane<br />
catch, particularly in fishing years 2000-2002. Never<strong>the</strong>less <strong>the</strong>se tables offer some indication of<br />
<strong>the</strong> relative variability over time of <strong>the</strong> sector vessels species composition and its catch relative to<br />
<strong>the</strong> total commercial catch.<br />
Table 5: Port Clyde Sector’s Species/stock Composition of Catch as a Percentage<br />
of <strong>the</strong> Sector’s Total <strong>Groundfish</strong> Catch by Fishing Year<br />
<strong>Groundfish</strong> Stock FY 1996 FY 1997 FY 1998 FY 1999 FY 2000 FY 2001 FY 2002 FY 2003 FY 2004 FY 2005<br />
GOM cod 16.9% 10.3% 5.5% 3.8% 6.4% 6.7% 4.6% 3.0% 5.0% 10.9%<br />
GOM haddock 0.2% 0.3% 0.3% 0.3% 0.5% 2.5% 1.9% 2.4% 1.8% 3.1%<br />
Hake 6.8% 6.4% 3.8% 2.5% 4.6% 4.7% 8.0% 7.2% 6.9% 6.4%<br />
Nor<strong>the</strong>rn Monkfish 16.4% 17.4% 20.3% 25.4% 27.2% 26.2% 28.3% 29.1% 27.6% 21.4%<br />
Plaice 30.4% 30.3% 38.7% 34.6% 32.2% 30.3% 29.8% 30.3% 19.0% 18.0%<br />
Pollock 0.8% 8.8% 3.6% 2.6% 1.8% 3.0% 4.7% 4.7% 5.5% 10.8%<br />
Redfish 0.2% 0.3% 0.6% 0.7% 0.6% 0.9% 1.0% 2.0% 1.8% 2.7%<br />
GOM/GB windowpane 0.0% 0.0% 0.2% 0.0% 1.3% 0.7% 1.9% 0.5% 0.3% 0.2%<br />
GOM winter flounder 1.3% 1.2% 0.4% 1.8% 1.0% 1.2% 1.0% 0.1% 0.2% 0.0%<br />
Witch flounder 25.2% 23.9% 25.7% 26.5% 21.8% 21.4% 17.9% 20.4% 31.7% 26.3%<br />
Cape Cod Yellowtail flounder 1.5% 0.9% 0.7% 1.4% 2.1% 1.4% 0.5% 0.0% 0.0% 0.0%<br />
GOM Yellowtail flounder 0.0% 0.0% 0.0% 0.0% 0.1% 0.0% 0.0% 0.0% 0.0% 0.0%<br />
Table 6: Port Clyde Sector’s Share of Total Commercial Catch by Stock and Fishing Year<br />
Based on VTR Catch Reports<br />
<strong>Groundfish</strong> Stock FY 1996 FY 1997 FY 1998 FY 1999 FY 2000 FY 2001 FY 2002 FY 2003 FY 2004 FY 2005<br />
GOM cod 1.4% 1.3% 1.2% 2.0% 1.9% 1.8% 1.2% 0.6% 0.8% 1.8%<br />
GOM haddock 0.4% 0.3% 0.2% 0.4% 0.6% 2.3% 1.8% 1.4% 1.1% 2.4%<br />
Hake 1.5% 2.1% 1.6% 1.4% 3.3% 2.9% 3.3% 1.7% 2.1% 2.3%<br />
Nor<strong>the</strong>rn Monkfish 2.1% 3.5% 4.0% 3.3% 3.8% 3.7% 3.2% 3.0% 2.9% 2.3%<br />
Plaice 3.3% 4.6% 6.5% 6.5% 6.2% 6.9% 7.5% 7.5% 5.8% 5.8%<br />
Pollock 0.1% 1.1% 0.4% 0.5% 0.5% 0.8% 1.1% 0.6% 0.6% 0.9%<br />
Redfish 0.3% 0.8% 1.0% 1.5% 1.7% 2.2% 2.5% 3.0% 1.9% 2.2%<br />
GOM/GB windowpane 0.0% 0.0% 0.7% 0.0% 9.3% 10.2% 17.3% 4.2% 3.4% 2.4%<br />
GOM winter flounder 1.1% 1.0% 0.6% 3.1% 1.5% 1.6% 0.9% 0.1% 0.2% 0.0%<br />
Witch flounder 6.1% 7.4% 8.1% 7.2% 7.1% 6.6% 4.5% 3.5% 5.4% 4.3%<br />
Cape Cod Yellowtail flounder 0.7% 0.4% 0.5% 0.6% 0.9% 0.6% 0.2% 0.0% 0.0% 0.0%<br />
GOM Yellowtail flounder 0.2% 0.0% 0.0% 0.2% 1.2% 0.2% 0.1% 0.0% 0.0% 0.0%<br />
The catch composition of <strong>the</strong> Port Clyde sector has shifted toward greater reliance on monkfish<br />
and less reliance on cod over this period. In <strong>the</strong> past few years increases in pollock and redfish<br />
catch have offset decreases in plaice. Since sectors allocate a share of TACs, it is probably more<br />
important to look at how <strong>the</strong> Port Clyde sector’s share of overall commercial catch has changed<br />
over time. Comparing <strong>the</strong> early years to <strong>the</strong> later years, <strong>the</strong> sector’s share of haddock catch has<br />
24