Community-based Sectors for the New England Groundfish Fishery
Community-based Sectors for the New England Groundfish Fishery
Community-based Sectors for the New England Groundfish Fishery

Create successful ePaper yourself
Turn your PDF publications into a flip-book with our unique Google optimized e-Paper software.
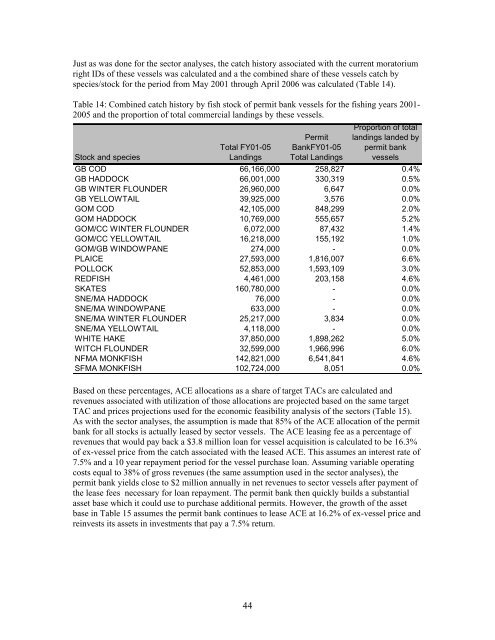
Just as was done <strong>for</strong> <strong>the</strong> sector analyses, <strong>the</strong> catch history associated with <strong>the</strong> current moratorium<br />
right IDs of <strong>the</strong>se vessels was calculated and a <strong>the</strong> combined share of <strong>the</strong>se vessels catch by<br />
species/stock <strong>for</strong> <strong>the</strong> period from May 2001 through April 2006 was calculated (Table 14).<br />
Table 14: Combined catch history by fish stock of permit bank vessels <strong>for</strong> <strong>the</strong> fishing years 2001-<br />
2005 and <strong>the</strong> proportion of total commercial landings by <strong>the</strong>se vessels.<br />
Stock and species<br />
Total FY01-05<br />
Landings<br />
Permit<br />
BankFY01-05<br />
Total Landings<br />
Proportion of total<br />
landings landed by<br />
permit bank<br />
vessels<br />
GB COD 66,166,000 258,827 0.4%<br />
GB HADDOCK 66,001,000 330,319 0.5%<br />
GB WINTER FLOUNDER 26,960,000 6,647 0.0%<br />
GB YELLOWTAIL 39,925,000 3,576 0.0%<br />
GOM COD 42,105,000 848,299 2.0%<br />
GOM HADDOCK 10,769,000 555,657 5.2%<br />
GOM/CC WINTER FLOUNDER 6,072,000 87,432 1.4%<br />
GOM/CC YELLOWTAIL 16,218,000 155,192 1.0%<br />
GOM/GB WINDOWPANE 274,000 - 0.0%<br />
PLAICE 27,593,000 1,816,007 6.6%<br />
POLLOCK 52,853,000 1,593,109 3.0%<br />
REDFISH 4,461,000 203,158 4.6%<br />
SKATES 160,780,000 - 0.0%<br />
SNE/MA HADDOCK 76,000 - 0.0%<br />
SNE/MA WINDOWPANE 633,000 - 0.0%<br />
SNE/MA WINTER FLOUNDER 25,217,000 3,834 0.0%<br />
SNE/MA YELLOWTAIL 4,118,000 - 0.0%<br />
WHITE HAKE 37,850,000 1,898,262 5.0%<br />
WITCH FLOUNDER 32,599,000 1,966,996 6.0%<br />
NFMA MONKFISH 142,821,000 6,541,841 4.6%<br />
SFMA MONKFISH 102,724,000 8,051 0.0%<br />
Based on <strong>the</strong>se percentages, ACE allocations as a share of target TACs are calculated and<br />
revenues associated with utilization of those allocations are projected <strong>based</strong> on <strong>the</strong> same target<br />
TAC and prices projections used <strong>for</strong> <strong>the</strong> economic feasibility analysis of <strong>the</strong> sectors (Table 15).<br />
As with <strong>the</strong> sector analyses, <strong>the</strong> assumption is made that 85% of <strong>the</strong> ACE allocation of <strong>the</strong> permit<br />
bank <strong>for</strong> all stocks is actually leased by sector vessels. The ACE leasing fee as a percentage of<br />
revenues that would pay back a $3.8 million loan <strong>for</strong> vessel acquisition is calculated to be 16.3%<br />
of ex-vessel price from <strong>the</strong> catch associated with <strong>the</strong> leased ACE. This assumes an interest rate of<br />
7.5% and a 10 year repayment period <strong>for</strong> <strong>the</strong> vessel purchase loan. Assuming variable operating<br />
costs equal to 38% of gross revenues (<strong>the</strong> same assumption used in <strong>the</strong> sector analyses), <strong>the</strong><br />
permit bank yields close to $2 million annually in net revenues to sector vessels after payment of<br />
<strong>the</strong> lease fees necessary <strong>for</strong> loan repayment. The permit bank <strong>the</strong>n quickly builds a substantial<br />
asset base which it could use to purchase additional permits. However, <strong>the</strong> growth of <strong>the</strong> asset<br />
base in Table 15 assumes <strong>the</strong> permit bank continues to lease ACE at 16.2% of ex-vessel price and<br />
reinvests its assets in investments that pay a 7.5% return.<br />
44