Geological Survey of Denmark and Greenland Bulletin 26 ... - Geus
Geological Survey of Denmark and Greenland Bulletin 26 ... - Geus
Geological Survey of Denmark and Greenland Bulletin 26 ... - Geus

You also want an ePaper? Increase the reach of your titles
YUMPU automatically turns print PDFs into web optimized ePapers that Google loves.
Baltic Sea. Such a map shows only the general pattern, so in<br />
order to underst<strong>and</strong> the mechanism <strong>of</strong> gas production below<br />
the seabed it was necessary to make detailed studies in a few<br />
key areas. The Bornholm Basin was selected as one <strong>of</strong> these<br />
key areas, because it is well known for gas-rich sediments <strong>and</strong><br />
because seismic data from previous surveys together with the<br />
new data made it possible to get a full coverage <strong>of</strong> the basin<br />
with limited supplementary work during the cruises (Fig. 2).<br />
The Bornholm Basin is located north-east <strong>of</strong> the isl<strong>and</strong><br />
<strong>of</strong> Bornholm in an area that has been influenced by block<br />
faulting. It is possible that faulting continued into the Holocene.<br />
The Bornholm Basin is bounded by major faults <strong>and</strong><br />
has been interpreted as a half-graben (Fig. 3; Vejbæk 1985;<br />
Wannäs & Flodén 1994; Sviridov et al. 1995) in which thick<br />
packages <strong>of</strong> late glacial <strong>and</strong> Holocene sediments have been<br />
deposited. In spite <strong>of</strong> the post-half-graben sedimentation history,<br />
the present bathymetry clearly reflects the deeper structures<br />
(Fig. 4). Two inflow channels are found in the southeastern<br />
part <strong>of</strong> the basin.<br />
It is a characteristic feature <strong>of</strong> the basin that late glacial<br />
<strong>and</strong> early Holocene clay deposits drape the glacial surface,<br />
whereas the marine Holocene mud sediments form a wedgelike<br />
sediment body (Fig. 5). This difference reflects different<br />
sedimentation mechanisms, from vertical settling <strong>of</strong> sediment<br />
particles to settling influenced by inflowing currents<br />
during the marine Littorina Sea stage.<br />
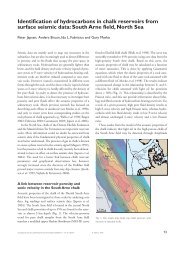
A map showing the thickness <strong>of</strong> the Holocene marine mud<br />
based on the depth <strong>of</strong> the seabed <strong>and</strong> the bottom <strong>of</strong> the Holocene<br />
marine mud is shown in Fig. 6. A clear connection between<br />
the thickness <strong>of</strong> the mud <strong>and</strong> the down-faulted blocks<br />
is seen; the mud reaches a thickness <strong>of</strong> more than 12 m in the<br />
vicinity <strong>of</strong> the fault scarp <strong>of</strong> the half-graben, but only a few<br />
metres in the deepest, central part <strong>of</strong> the Bornholm Basin.<br />
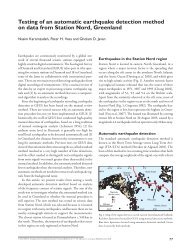
Acoustic blanking is seen in many seismic pr<strong>of</strong>iles. This is<br />
caused by scattering due to gas bubbles in the sediment. A gas<br />
distribution map has been compiled showing the depth from<br />
the seabed to the top <strong>of</strong> the acoustic gas front (Fig. 7). Experience<br />
tells us that a critical thickness <strong>of</strong> organic-rich Holocene<br />
marine mud must be reached before free gas bubbles form. In<br />
the Bornholm Basin where water depths in the order <strong>of</strong> 90<br />
m are found, acoustic blanking starts where the Holocene<br />
organic-rich mud reaches a thickness <strong>of</strong> 6–8 m. The depth<br />
from the seabed to the top <strong>of</strong> the acoustic gas front is an important<br />
parameter in modelling methane fluxes. Our study<br />
shows that in the Bornholm Basin the gas front is located<br />
less than 0.5 m below the seabed, in areas with the highest<br />
sedimentation rates <strong>of</strong> organic-rich mud.<br />
Acoustic properties <strong>and</strong> physical<br />
characteristics <strong>of</strong> gas-charged sediments<br />
The data acquired from multi-sensor core logging <strong>and</strong> sedimentological<br />
analyses were used for geo-acoustic models <strong>and</strong><br />
interpretation <strong>of</strong> the seismo-acoustic records. The physical<br />
properties <strong>and</strong> the geo-acoustical data were used to investigate<br />
the influence <strong>of</strong> gas bubbles on the acoustic properties<br />
<strong>and</strong> the strength <strong>of</strong> the muddy sediments.<br />
The acoustic properties such as sound velocity <strong>and</strong> attenuation<br />
are strongly influenced by gas bubbles in the sediments,<br />
as illustrated in the sediment echo sounder <strong>and</strong> seismic records<br />
(Fig. 5). The behaviour <strong>of</strong> acoustic signals is very complex<br />
<strong>and</strong> controlled by environmental parameters including<br />
pressure <strong>and</strong> temperature, the sound frequency <strong>and</strong> the<br />
physical properties <strong>of</strong> the different sedimentary components<br />
(solid grains, water <strong>and</strong> gas bubbles). The physical properties<br />
determined on sediment cores or samples from sediment<br />
Thickness (m)<br />
0–2<br />
2–4<br />
4–6<br />
6–8<br />
8–10<br />
10–12<br />
>12<br />
Depth (m)<br />
0.0–0.5<br />
0.5–1.0<br />
1.0–1.5<br />
1.5–2.0<br />
2.0–2.5<br />
2.5–3.0<br />
3.0–3.5<br />
3.5–4.0<br />
4.0–4.5<br />
4.5–5.0<br />
>5<br />
10 km<br />
10 km<br />
Fig. 6. Map <strong>of</strong> the Bormholm Basin showing the thickness <strong>of</strong> Holocene<br />
marine mud. Deeper structures are represented by the faults (black stippled<br />
lines).<br />
Fig. 7. Mapped areas with acoustic blanks caused by scattering due to<br />
gas bubbles in the sediment. The depth from the seabed to the top <strong>of</strong> the<br />
acoustic gas front is shown.<br />
23