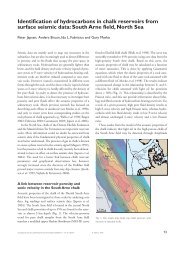
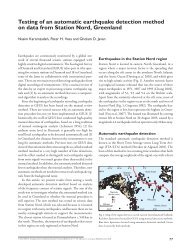
Geological Survey of Denmark and Greenland Bulletin 26 ... - Geus
Geological Survey of Denmark and Greenland Bulletin 26 ... - Geus
Geological Survey of Denmark and Greenland Bulletin 26 ... - Geus

Create successful ePaper yourself
Turn your PDF publications into a flip-book with our unique Google optimized e-Paper software.
C 1<br />
/(C 2<br />
+C 3<br />
)<br />
10 5<br />
remained at the low levels measured prior to the storage <strong>of</strong><br />
natural gas (Fig. 6).<br />
Microbial gas<br />
10 3<br />
10 2<br />
10<br />
Thermogenic<br />
gas<br />
0<br />
–100<br />
–80 –60 –40 –20<br />
10 4 δ 13 C CH4<br />
(‰)<br />
Dissolved gas in the upper aquifer <strong>of</strong> the K1 observation well<br />
Dissolved gas in the shallow aquifers<br />
Natural gas from the Danish North Sea<br />
Dissolved gas in the lower aquifer <strong>of</strong> K1 from the gas leakage in 1995<br />
Fig. 4. Classification diagram showing the chemical <strong>and</strong> isotopic composition<br />
<strong>of</strong> natural gas from the Danish North Sea <strong>and</strong> dissolved gas in shallow<br />
aquifers. The C 1<br />
/(C 2<br />
+C 3<br />
) ratio for the dissolved gas represents a minimum<br />
value as both ethane <strong>and</strong> propane were below detection limit for all<br />
dissolved gases. The white areas are typical <strong>of</strong> thermogenic <strong>and</strong> microbial<br />
gas <strong>and</strong> the grey area represents either mixtures <strong>of</strong> these gas types or gas <strong>of</strong><br />
unknown origin. C 1<br />
: methane concentration, C 2<br />
: ethane concentration,<br />
C 3<br />
: propane concentration.<br />
Minor gas leakage<br />
In September 1995, gas bubbles were observed at the terrain<br />
surface near the newly drilled St14 injection well (Fig. 1), <strong>and</strong><br />
a sample <strong>of</strong> the gas was immediately collected <strong>and</strong> analysed.<br />
Its chemical <strong>and</strong> isotopic composition was similar to that <strong>of</strong><br />
the gas being stored (Fig. 4), so there was little doubt that<br />
gas leaked from the new well. The leak was due to technical<br />
problems during gas injection (Laier & Øbro 2009) <strong>and</strong> was<br />
quickly stopped, but an estimated 5000 m 3 <strong>of</strong> gas was lost to<br />
geological formations above the reservoir cap rock.<br />
A week after the leak was observed at the surface, a significant<br />
increase in the dissolved gas concentration was measured<br />
in the deep filter <strong>of</strong> the K1 well, located 250 m from<br />
the St14 well. This gas had almost the same composition as<br />
the reservoir gas (Fig. 4). No free gas was observed during<br />
collection <strong>of</strong> water from this level, so it was concluded that<br />
all the gas was dissolved at this time. However, for the gas<br />
to migrate from St14 to K1 during a week, a free gas phase<br />
CH 4<br />
(mg/l)<br />
10<br />
8<br />
6<br />
4<br />
2<br />
Start <strong>of</strong><br />
injection<br />
10<br />
27 mg/l<br />
35–45 m<br />
98–128 m<br />
0<br />
89 91 93 95 97 99 01 03 05 07 09 11<br />
Year<br />
Fig 5. Methane concentration in groundwater from the K1 observation<br />
well. The sudden increase in dissolved methane was noted one week after<br />
the gas leakage at St14.<br />
tion was due to a leakage around the nearby St2 well (Fig. 1),<br />
the opposite might be expected with an increase in methane<br />
at the deeper level first. In order to deduce the origin <strong>of</strong> the<br />
methane, isotope analyses were regularly performed during<br />
the first year <strong>of</strong> sampling. The isotope ratio <strong>of</strong> the methane<br />
(δ 13 C CH4 : –62 to –52‰) together with a lack <strong>of</strong> higher hydrocarbons<br />
indicate that the methane was bacterial in origin<br />
(Fig. 4), though its source remains unknown. Since the methane<br />
concentration was highest during the first years after<br />
drilling the K1 well, one may speculate whether hydrogen<br />
generated by anaerobic corrosion <strong>of</strong> iron filings from drilling<br />
may have led to methane formation as suggested by Daniels<br />
et al. (1987). Groundwater methane concentration in water<br />
from the Stenlille waterworks <strong>and</strong> from private water wells<br />
CH 4<br />
(mg/l)<br />
CH 4<br />
(mg/l)<br />
0.2<br />
0.1<br />
0<br />
0.4<br />
0.3<br />
0.2<br />
0.1<br />
257<br />
520<br />
502<br />
518<br />
529<br />
400<br />
558<br />
407<br />
0<br />
89 91 93 95 97 99 01 03 05 07 09 11<br />
Year<br />
Fig. 6. Methane concentration in groundwater from wells supplying the<br />
Stenlille waterworks (A) <strong>and</strong> from private wells (B).<br />
A<br />
B<br />
47