Geological Survey of Denmark and Greenland Bulletin 26 ... - Geus
Geological Survey of Denmark and Greenland Bulletin 26 ... - Geus
Geological Survey of Denmark and Greenland Bulletin 26 ... - Geus

You also want an ePaper? Increase the reach of your titles
YUMPU automatically turns print PDFs into web optimized ePapers that Google loves.
From 3D mapping to 3D modelling: a case study from<br />
the Skaergaard intrusion, southern East Greenl<strong>and</strong><br />
Kristian Svennevig <strong>and</strong> Pierpaolo Guarnieri<br />
The powerful 3D mapping tool at the photogrammetry<br />
laboratory <strong>of</strong> the <strong>Geological</strong> <strong>Survey</strong> <strong>of</strong> <strong>Denmark</strong> <strong>and</strong> Greenl<strong>and</strong><br />
(GEUS) is ideal for collecting high-quality 3D geological<br />
data in remote <strong>and</strong> inaccessible areas with a high degree<br />
<strong>of</strong> exposure such as Greenl<strong>and</strong> (Vosgerau et al. 2010). So far<br />
this 3D mapping tool has been used to visualise <strong>and</strong> extract<br />
very precise geological data from aerial <strong>and</strong> oblique photographs.<br />
In the study reported on here, the 3D mapping tool<br />
was used to generate data for 3D geological modelling. The<br />
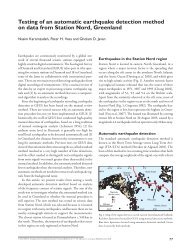
Skaergaard intrusion (Fig. 1) is a well-known Eocene layered<br />
gabbro. The study <strong>of</strong> the intrusion has had great importance<br />
for the underst<strong>and</strong>ing <strong>of</strong> magmatic petrology, magma differentiation<br />
<strong>and</strong> fractional crystallisation since the early studies<br />
by Wager & Deer (1939). It was chosen for 3D modelling<br />
because it is well studied from a petrological point <strong>of</strong> view<br />
<strong>and</strong> because the shape <strong>of</strong> the magma chamber was previously<br />
modelled in a network <strong>of</strong> 2D cross sections (Nielsen 2004).<br />
In this paper, it is modelled for the first time in 3D using<br />
a detailed 1:20 000 scale geological map (McBirney 1989),<br />
1:27 000 scale aerial photographs from 1973, data from drill<br />
holes <strong>and</strong> geophysical data.<br />
Furthermore polylines from the aerial photographs have real<br />
3D coordinates measured directly on the 3D stereo plotter,<br />
whereas polylines from the ArcGIS map have X-Y coordinates<br />
from the map <strong>and</strong> Z coordinates imported from the<br />
digital elevation model. This leads to additional uncertainty<br />
as elevations in the ArcGIS map <strong>and</strong> the digital elevation<br />
model are not generated from the same source <strong>and</strong> sometimes<br />
do not overlap in the entire area <strong>of</strong> interest.<br />
Structural readings (dip direction <strong>and</strong> dip angle) for<br />
the geological boundaries were generated from polylines<br />
using the in-house-developed s<strong>of</strong>tware tool GEUS Planes<br />
(Fig. 2B). This tool calculates strike, dip <strong>and</strong> st<strong>and</strong>ard deviations<br />
on strike <strong>and</strong> dip for each node (vertex) <strong>of</strong> a polyline,<br />
generating large amounts <strong>of</strong> strike-dip measurements from<br />
the 3D geometry <strong>of</strong> the geological boundaries.<br />
3D modelling <strong>and</strong> discussion<br />
The 3D modelling <strong>of</strong> the Skaergaard intrusion was carried<br />
out using the s<strong>of</strong>tware tool Leapfrog-3D. This s<strong>of</strong>tware can<br />
generate surfaces <strong>and</strong> volumes from structural readings,<br />
3D mapping<br />
The 1:27 000 scale aerial photographs where scanned, triangulated<br />
<strong>and</strong> georeferenced with Socketset s<strong>of</strong>tware. The<br />
geological map was digitised as well as georeferenced using<br />
1:150 000 scale aerial photographs <strong>and</strong> finally draped on a<br />
high-resolution (10 × 10 m grid) digital elevation model derived<br />
from the 1:27 000 scale aerial photographs. <strong>Geological</strong><br />
features were drawn as polylines from both the aerial photographs<br />
<strong>and</strong> the geological map. Visible parts <strong>of</strong> the outer<br />
boundary were collected using the 3D stereoplotter (Fig. 2A)<br />
with very high accuracy (Vosgerau et al. 2010). Oblique aerial<br />
photos were not used for 3D-mapping as the area is not<br />
sufficiently covered <strong>and</strong> the setting up <strong>of</strong> the few available<br />
photo lines is beyond the scope <strong>of</strong> this paper. Other boundaries<br />
defined from mineral parageneses <strong>and</strong> compositions<br />
(Wager & Brown 1968) were digitised from the 1:20 000<br />
map in ArcGIS. The boundaries from the aerial photographs<br />
are much more accurate than those <strong>of</strong> the map (Fig. 3) because<br />
they represent directly observable geological features.<br />
68°15´N<br />
Fig. 3<br />
Watkins Fjord<br />
5 km<br />
Skaergaard<br />
intrusion<br />
Mainly Palaeogene volcanic rocks<br />
Palaeogene gabbro, including the Skaergaard intrusion<br />
Mesozoic<br />
Precambrian basement<br />
Glaciers<br />
Fig. 1. The Skaergaard intrusion area, southern East Greenl<strong>and</strong>.<br />
Greenl<strong>and</strong><br />
Miki Fjord<br />
31°25´W<br />
© 2012 GEUS. <strong>Geological</strong> <strong>Survey</strong> <strong>of</strong> <strong>Denmark</strong> <strong>and</strong> Greenl<strong>and</strong> <strong>Bulletin</strong> <strong>26</strong>, 57–60. Open access: www.geus.dk/publications/bull<br />
57