Ecoregional Assessment of Biological Diversity in East Kalimantan
Ecoregional Assessment of Biological Diversity in East Kalimantan
Ecoregional Assessment of Biological Diversity in East Kalimantan

Create successful ePaper yourself
Turn your PDF publications into a flip-book with our unique Google optimized e-Paper software.
<strong>East</strong> <strong>Kalimantan</strong> <strong>Ecoregional</strong> <strong>Assessment</strong>: Chapter 1 – Background & Analysis Process<br />
Identification <strong>of</strong> annual precipitation zones<br />
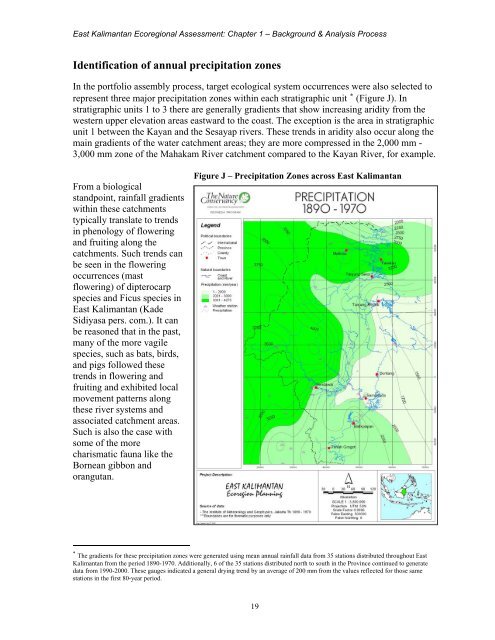
In the portfolio assembly process, target ecological system occurrences were also selected to<br />
represent three major precipitation zones with<strong>in</strong> each stratigraphic unit ∗ (Figure J). In<br />
stratigraphic units 1 to 3 there are generally gradients that show <strong>in</strong>creas<strong>in</strong>g aridity from the<br />
western upper elevation areas eastward to the coast. The exception is the area <strong>in</strong> stratigraphic<br />
unit 1 between the Kayan and the Sesayap rivers. These trends <strong>in</strong> aridity also occur along the<br />
ma<strong>in</strong> gradients <strong>of</strong> the water catchment areas; they are more compressed <strong>in</strong> the 2,000 mm -<br />
3,000 mm zone <strong>of</strong> the Mahakam River catchment compared to the Kayan River, for example.<br />
From a biological<br />
standpo<strong>in</strong>t, ra<strong>in</strong>fall gradients<br />
with<strong>in</strong> these catchments<br />
typically translate to trends<br />
<strong>in</strong> phenology <strong>of</strong> flower<strong>in</strong>g<br />
and fruit<strong>in</strong>g along the<br />
catchments. Such trends can<br />
be seen <strong>in</strong> the flower<strong>in</strong>g<br />
occurrences (mast<br />
flower<strong>in</strong>g) <strong>of</strong> dipterocarp<br />
species and Ficus species <strong>in</strong><br />
<strong>East</strong> <strong>Kalimantan</strong> (Kade<br />
Sidiyasa pers. com.). It can<br />
be reasoned that <strong>in</strong> the past,<br />
many <strong>of</strong> the more vagile<br />
species, such as bats, birds,<br />
and pigs followed these<br />
trends <strong>in</strong> flower<strong>in</strong>g and<br />
fruit<strong>in</strong>g and exhibited local<br />
movement patterns along<br />
these river systems and<br />
associated catchment areas.<br />
Such is also the case with<br />
some <strong>of</strong> the more<br />
charismatic fauna like the<br />
Bornean gibbon and<br />
orangutan.<br />
Figure J – Precipitation Zones across <strong>East</strong> <strong>Kalimantan</strong><br />
∗ The gradients for these precipitation zones were generated us<strong>in</strong>g mean annual ra<strong>in</strong>fall data from 35 stations distributed throughout <strong>East</strong><br />
<strong>Kalimantan</strong> from the period 1890-1970. Additionally, 6 <strong>of</strong> the 35 stations distributed north to south <strong>in</strong> the Prov<strong>in</strong>ce cont<strong>in</strong>ued to generate<br />
data from 1990-2000. These gauges <strong>in</strong>dicated a general dry<strong>in</strong>g trend by an average <strong>of</strong> 200 mm from the values reflected for those same<br />
stations <strong>in</strong> the first 80-year period.<br />
19