Ecoregional Assessment of Biological Diversity in East Kalimantan
Ecoregional Assessment of Biological Diversity in East Kalimantan
Ecoregional Assessment of Biological Diversity in East Kalimantan

You also want an ePaper? Increase the reach of your titles
YUMPU automatically turns print PDFs into web optimized ePapers that Google loves.
<strong>East</strong> <strong>Kalimantan</strong> <strong>Ecoregional</strong> <strong>Assessment</strong>: Chapter 1 – Background & Analysis Process<br />
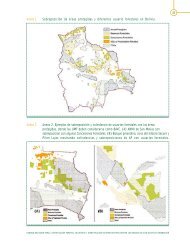
Rank<strong>in</strong>g condition <strong>of</strong> Upper Catchment<br />
areas, Mid Stream and Delta areas<br />
The condition <strong>of</strong> the three river segments was<br />
ranked <strong>in</strong> exactly the same way that<br />
condition was ranked <strong>in</strong>side an occurrence or<br />
for the landscape context <strong>of</strong> an occurrence<br />
(see subsection entitled Terrestrial<br />
Occurrences above. However, slightly<br />
different load<strong>in</strong>g factors were applied (Table<br />
1.3).<br />
Table 1.3. Reference table for values to apply to condition <strong>of</strong> the three segments<br />
<strong>in</strong>volved <strong>in</strong> determ<strong>in</strong><strong>in</strong>g the viability <strong>in</strong>dex <strong>of</strong> the Major Rivers:<br />
River Part / Condition Very Good Good Poor Very Poor<br />
Upper Catchment 60 40 10 0<br />
Midstream 30 20 5 0<br />
Delta area 10 7 2 0<br />
A complication arises when a river has more than one pr<strong>in</strong>cipal Upper Catchment area. In<br />
such cases, the values for the river were derived from a summation <strong>of</strong> the comb<strong>in</strong>ed area <strong>of</strong><br />
all its selected Upper Catchments. Each <strong>in</strong>dividual catchment polygon was ranked and<br />
multiplied by the proportion <strong>of</strong> the total comb<strong>in</strong>ed area they represent to that river. The<br />
viability <strong>in</strong>dex for these rivers was achieved by cluster<strong>in</strong>g their accumulated rank values <strong>in</strong>to<br />
statistical quartiles - and then us<strong>in</strong>g these quartiles to rank them as Very Good, Good, Poor<br />
and Very Poor. The follow<strong>in</strong>g diagram illustrates the component rank<strong>in</strong>gs for a s<strong>in</strong>gle river <strong>in</strong><br />
Stratigraphic Unit 2 as an example.<br />
30