

PHYS07200604007 Manas Kumar Dala - Homi Bhabha National ...
PHYS07200604007 Manas Kumar Dala - Homi Bhabha National ...
PHYS07200604007 Manas Kumar Dala - Homi Bhabha National ...

You also want an ePaper? Increase the reach of your titles
YUMPU automatically turns print PDFs into web optimized ePapers that Google loves.
Electronic Structure of Pr 1−x Ca x MnO 3 84<br />
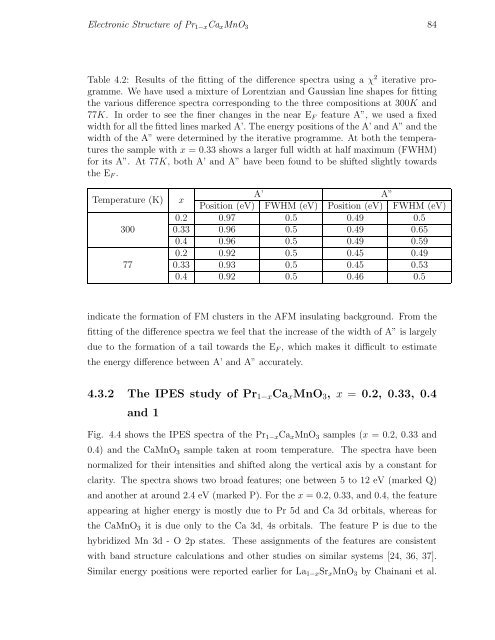
Table 4.2: Results of the fitting of the difference spectra using a χ 2 iterative programme.<br />
We have used a mixture of Lorentzian and Gaussian line shapes for fitting<br />
the various difference spectra corresponding to the three compositions at 300K and<br />
77K. In order to see the finer changes in the near E F feature A”, we used a fixed<br />
width for all the fitted lines marked A’. The energy positions of the A’ and A” and the<br />
width of the A” were determined by the iterative programme. At both the temperatures<br />
the sample with x = 0.33 shows a larger full width at half maximum (FWHM)<br />
for its A”. At 77K, both A’ and A” have been found to be shifted slightly towards<br />
the E F .<br />
Temperature (K)<br />
300<br />
77<br />
x<br />
A’ A”<br />
Position (eV) FWHM (eV) Position (eV) FWHM (eV)<br />
0.2 0.97 0.5 0.49 0.5<br />
0.33 0.96 0.5 0.49 0.65<br />
0.4 0.96 0.5 0.49 0.59<br />
0.2 0.92 0.5 0.45 0.49<br />
0.33 0.93 0.5 0.45 0.53<br />
0.4 0.92 0.5 0.46 0.5<br />
indicate the formation of FM clusters in the AFM insulating background. From the<br />
fitting of the difference spectra we feel that the increase of the width of A” is largely<br />
due to the formation of a tail towards the E F , which makes it difficult to estimate<br />
the energy difference between A’ and A” accurately.<br />
4.3.2 The IPES study of Pr 1−x Ca x MnO 3 , x = 0.2, 0.33, 0.4<br />
and 1<br />
Fig. 4.4 shows the IPES spectra of the Pr 1−x Ca x MnO 3 samples (x = 0.2, 0.33 and<br />
0.4) and the CaMnO 3 sample taken at room temperature. The spectra have been<br />
normalized for their intensities and shifted along the vertical axis by a constant for<br />
clarity. The spectra shows two broad features; one between 5 to 12 eV (marked Q)<br />
and another at around 2.4 eV (marked P). For the x = 0.2, 0.33, and 0.4, the feature<br />
appearing at higher energy is mostly due to Pr 5d and Ca 3d orbitals, whereas for<br />
the CaMnO 3 it is due only to the Ca 3d, 4s orbitals. The feature P is due to the<br />
hybridized Mn 3d - O 2p states. These assignments of the features are consistent<br />
with band structure calculations and other studies on similar systems [24, 36, 37].<br />
Similar energy positions were reported earlier for La 1−x Sr x MnO 3 by Chainani et al.


