

PHYS07200604007 Manas Kumar Dala - Homi Bhabha National ...
PHYS07200604007 Manas Kumar Dala - Homi Bhabha National ...
PHYS07200604007 Manas Kumar Dala - Homi Bhabha National ...

You also want an ePaper? Increase the reach of your titles
YUMPU automatically turns print PDFs into web optimized ePapers that Google loves.
Electronic Structure of Pr 0.67 Ca 0.33 MnO 3 64<br />
300 K<br />
77 K<br />
5 X Difference<br />
(a)<br />
300 K<br />
110 K<br />
5 X Difference<br />
(b)<br />
Intensity (arb. units)<br />
-1 -0.5 0 0.5 1 1.5<br />
300 K<br />
220 K<br />
5 X Difference<br />
(d)<br />
-1 -0.5 0 0.5 1 1.5<br />
300 K<br />
150 K<br />
5 X Difference<br />
(c)<br />
-1 -0.5 0 0.5 1 1.5<br />
Binding Energy (eV)<br />
-1 -0.5 0 0.5 1 1.5<br />
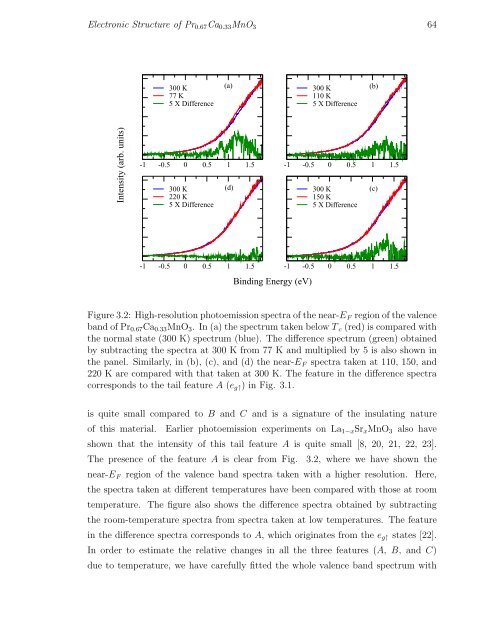
Figure 3.2: High-resolution photoemission spectra of the near-E F region of the valence<br />
band of Pr 0.67 Ca 0.33 MnO 3 . In (a) the spectrum taken below T c (red) is compared with<br />
the normal state (300 K) spectrum (blue). The difference spectrum (green) obtained<br />
by subtracting the spectra at 300 K from 77 K and multiplied by 5 is also shown in<br />
the panel. Similarly, in (b), (c), and (d) the near-E F spectra taken at 110, 150, and<br />
220 K are compared with that taken at 300 K. The feature in the difference spectra<br />
corresponds to the tail feature A (e g↑ ) in Fig. 3.1.<br />
is quite small compared to B and C and is a signature of the insulating nature<br />
of this material. Earlier photoemission experiments on La 1−x Sr x MnO 3 also have<br />
shown that the intensity of this tail feature A is quite small [8, 20, 21, 22, 23].<br />
The presence of the feature A is clear from Fig. 3.2, where we have shown the<br />
near-E F region of the valence band spectra taken with a higher resolution. Here,<br />
the spectra taken at different temperatures have been compared with those at room<br />
temperature. The figure also shows the difference spectra obtained by subtracting<br />
the room-temperature spectra from spectra taken at low temperatures. The feature<br />
in the difference spectra corresponds to A, which originates from the e g↑ states [22].<br />
In order to estimate the relative changes in all the three features (A, B, and C)<br />
due to temperature, we have carefully fitted the whole valence band spectrum with


