

PHYS07200604007 Manas Kumar Dala - Homi Bhabha National ...
PHYS07200604007 Manas Kumar Dala - Homi Bhabha National ...
PHYS07200604007 Manas Kumar Dala - Homi Bhabha National ...

You also want an ePaper? Increase the reach of your titles
YUMPU automatically turns print PDFs into web optimized ePapers that Google loves.
Electronic Structure of Pr 1−x Ca x MnO 3 85<br />
Q<br />
x=1<br />
P<br />
x=0.4<br />
Intensity (arb. units)<br />
x=0.33<br />
x=0.2<br />
0 2.5 5 7.5 10 12.5 15<br />
Energy Relative to Fermi Energy (eV)<br />
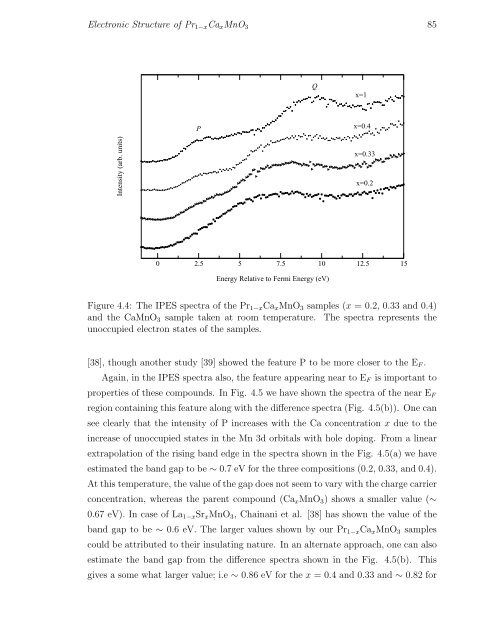
Figure 4.4: The IPES spectra of the Pr 1−x Ca x MnO 3 samples (x = 0.2, 0.33 and 0.4)<br />
and the CaMnO 3 sample taken at room temperature. The spectra represents the<br />
unoccupied electron states of the samples.<br />
[38], though another study [39] showed the feature P to be more closer to the E F .<br />
Again, in the IPES spectra also, the feature appearing near to E F is important to<br />
properties of these compounds. In Fig. 4.5 we have shown the spectra of the near E F<br />
region containing this feature along with the difference spectra (Fig. 4.5(b)). One can<br />
see clearly that the intensity of P increases with the Ca concentration x due to the<br />
increase of unoccupied states in the Mn 3d orbitals with hole doping. From a linear<br />
extrapolation of the rising band edge in the spectra shown in the Fig. 4.5(a) we have<br />
estimated the band gap to be ∼ 0.7 eV for the three compositions (0.2, 0.33, and 0.4).<br />
At this temperature, the value of the gap does not seem to vary with the charge carrier<br />
concentration, whereas the parent compound (Ca x MnO 3 ) shows a smaller value (∼<br />
0.67 eV). In case of La 1−x Sr x MnO 3 , Chainani et al. [38] has shown the value of the<br />
band gap to be ∼ 0.6 eV. The larger values shown by our Pr 1−x Ca x MnO 3 samples<br />
could be attributed to their insulating nature. In an alternate approach, one can also<br />
estimate the band gap from the difference spectra shown in the Fig. 4.5(b). This<br />
gives a some what larger value; i.e ∼ 0.86 eV for the x = 0.4 and 0.33 and ∼ 0.82 for


