

PHYS07200604007 Manas Kumar Dala - Homi Bhabha National ...
PHYS07200604007 Manas Kumar Dala - Homi Bhabha National ...
PHYS07200604007 Manas Kumar Dala - Homi Bhabha National ...

Create successful ePaper yourself
Turn your PDF publications into a flip-book with our unique Google optimized e-Paper software.
Experimental Techniques 25<br />
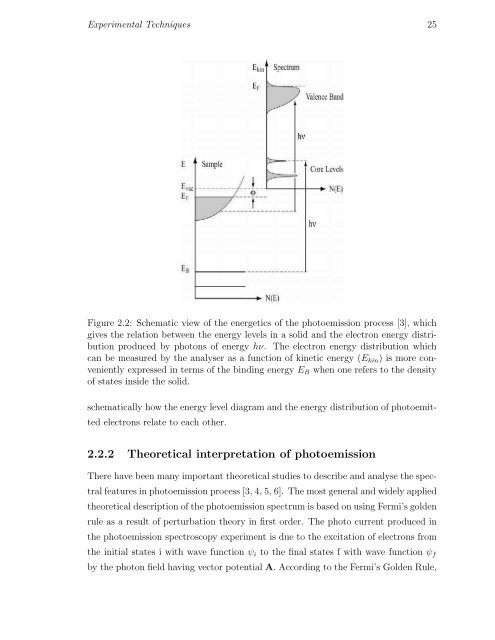
Figure 2.2: Schematic view of the energetics of the photoemission process [3], which<br />
gives the relation between the energy levels in a solid and the electron energy distribution<br />
produced by photons of energy hν. The electron energy distribution which<br />
can be measured by the analyser as a function of kinetic energy (E kin ) is more conveniently<br />
expressed in terms of the binding energy E B when one refers to the density<br />
of states inside the solid.<br />
schematically how the energy level diagram and the energy distribution of photoemitted<br />
electrons relate to each other.<br />
2.2.2 Theoretical interpretation of photoemission<br />
There have been many important theoretical studies to describe and analyse the spectral<br />
features in photoemission process [3, 4, 5, 6]. The most general and widely applied<br />
theoretical description of the photoemission spectrum is based on using Fermi’s golden<br />
rule as a result of perturbation theory in first order. The photo current produced in<br />
the photoemission spectroscopy experiment is due to the excitation of electrons from<br />
the initial states i with wave function ψ i to the final states f with wave function ψ f<br />
by the photon field having vector potential A. According to the Fermi’s Golden Rule,


