

PHYS07200604007 Manas Kumar Dala - Homi Bhabha National ...
PHYS07200604007 Manas Kumar Dala - Homi Bhabha National ...
PHYS07200604007 Manas Kumar Dala - Homi Bhabha National ...

Create successful ePaper yourself
Turn your PDF publications into a flip-book with our unique Google optimized e-Paper software.
Electronic Structure of Ca 0.86 Pr 0.14 MnO 3 100<br />
Intensity (arb. units)<br />
A<br />
30 K<br />
70 K<br />
110 K<br />
220 K<br />
300 K<br />
1.2<br />
1<br />
0.8<br />
0.6<br />
0.4<br />
0.2<br />
0<br />
-0.2<br />
Binding Energy (eV)<br />
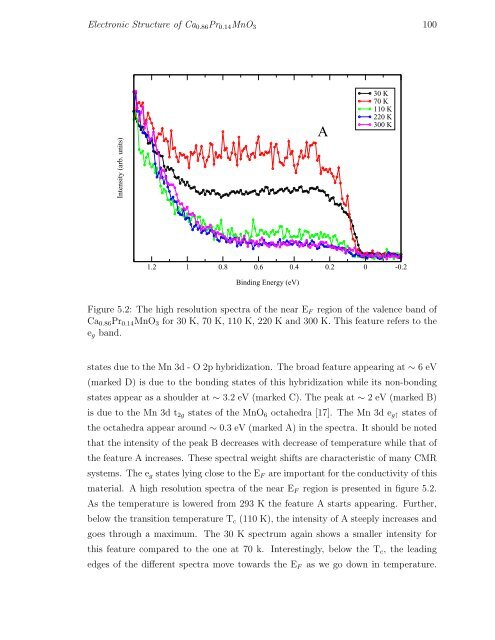
Figure 5.2: The high resolution spectra of the near E F region of the valence band of<br />
Ca 0.86 Pr 0.14 MnO 3 for 30 K, 70 K, 110 K, 220 K and 300 K. This feature refers to the<br />
e g band.<br />
states due to the Mn 3d - O 2p hybridization. The broad feature appearing at ∼ 6 eV<br />
(marked D) is due to the bonding states of this hybridization while its non-bonding<br />
states appear as a shoulder at ∼ 3.2 eV (marked C). The peak at ∼ 2 eV (marked B)<br />
is due to the Mn 3d t 2g states of the MnO 6 octahedra [17]. The Mn 3d e g↑ states of<br />
the octahedra appear around ∼ 0.3 eV (marked A) in the spectra. It should be noted<br />
that the intensity of the peak B decreases with decrease of temperature while that of<br />
the feature A increases. These spectral weight shifts are characteristic of many CMR<br />
systems. The e g states lying close to the E F are important for the conductivity of this<br />
material. A high resolution spectra of the near E F region is presented in figure 5.2.<br />
As the temperature is lowered from 293 K the feature A starts appearing. Further,<br />
below the transition temperature T c (110 K), the intensity of A steeply increases and<br />
goes through a maximum. The 30 K spectrum again shows a smaller intensity for<br />
this feature compared to the one at 70 k. Interestingly, below the T c , the leading<br />
edges of the different spectra move towards the E F as we go down in temperature.


