

PHYS07200604007 Manas Kumar Dala - Homi Bhabha National ...
PHYS07200604007 Manas Kumar Dala - Homi Bhabha National ...
PHYS07200604007 Manas Kumar Dala - Homi Bhabha National ...

Create successful ePaper yourself
Turn your PDF publications into a flip-book with our unique Google optimized e-Paper software.
Experimental Techniques 39<br />
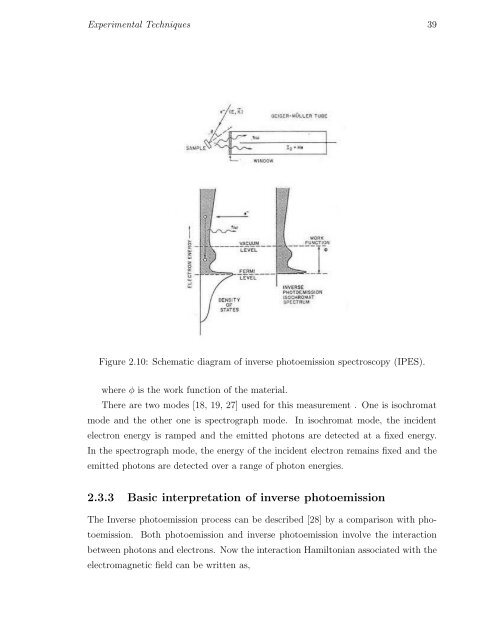
Figure 2.10: Schematic diagram of inverse photoemission spectroscopy (IPES).<br />
where φ is the work function of the material.<br />
There are two modes [18, 19, 27] used for this measurement . One is isochromat<br />
mode and the other one is spectrograph mode. In isochromat mode, the incident<br />
electron energy is ramped and the emitted photons are detected at a fixed energy.<br />
In the spectrograph mode, the energy of the incident electron remains fixed and the<br />
emitted photons are detected over a range of photon energies.<br />
2.3.3 Basic interpretation of inverse photoemission<br />
The Inverse photoemission process can be described [28] by a comparison with photoemission.<br />
Both photoemission and inverse photoemission involve the interaction<br />
between photons and electrons. Now the interaction Hamiltonian associated with the<br />
electromagnetic field can be written as,


