Determinants of Emotional Experiences in Traffic Situations ... - OPUS
Determinants of Emotional Experiences in Traffic Situations ... - OPUS
Determinants of Emotional Experiences in Traffic Situations ... - OPUS

You also want an ePaper? Increase the reach of your titles
YUMPU automatically turns print PDFs into web optimized ePapers that Google loves.
106 <strong>Emotional</strong> States <strong>of</strong> Drivers and Their Impact on Driv<strong>in</strong>g Behaviour!<br />
experiment participants rated their discrete emotions on the GEW after each section (rural, village,<br />
highway).<br />
4.2.2 Results<br />
4.2.2.1 Occurrence <strong>of</strong> Reported Drivers’ Emotions and Personal Characteristics<br />
After <strong>in</strong>duc<strong>in</strong>g the neutral or anger emotion <strong>in</strong> participants, a manipulation check with the GEW was<br />
performed. The anger group reported significantly stronger anger directly after the movie (M = 3.69;<br />
SD = 3.16) than the neutral group (M = 0.74; SD = 1.77; F(1;72) = 24.72; p < .001). But this<br />
difference disappeared later <strong>in</strong> the experiment: In the anger group, anger decreased to M = 0.94<br />
(SD = 1.92) on the rural road, M = 0.89 (SD = 1.91) <strong>in</strong> the village and M = 1.20 (SD = 1.93) on the<br />
highway. At the same time, anger levels <strong>of</strong> the neutral control group rema<strong>in</strong>ed relatively constant or<br />
were even higher at M = 0.82 (SD = 1.84), M = 1.47 (SD = 2.32) and M = 1.00 (SD = 1.74),<br />
respectively (all F-Values for group comparison were not significant anymore and ranged between<br />
0.242 and 0.938). The average mean for driv<strong>in</strong>g motivation was M = 3.69 (SD = 0.85), DAS-scores<br />
were at M = 3.20 (SD = 0.47).<br />
4.2.2.2 <strong>Determ<strong>in</strong>ants</strong> <strong>of</strong> the Drivers’ Emotion: Personal Factors<br />
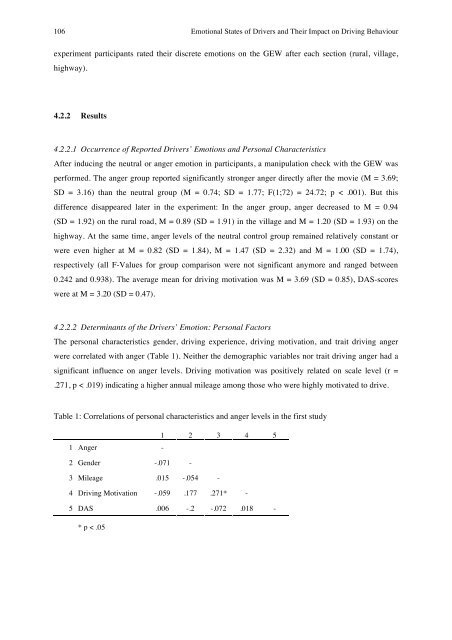
The personal characteristics gender, driv<strong>in</strong>g experience, driv<strong>in</strong>g motivation, and trait driv<strong>in</strong>g anger<br />
were correlated with anger (Table 1). Neither the demographic variables nor trait driv<strong>in</strong>g anger had a<br />
significant <strong>in</strong>fluence on anger levels. Driv<strong>in</strong>g motivation was positively related on scale level (r =<br />
.271, p < .019) <strong>in</strong>dicat<strong>in</strong>g a higher annual mileage among those who were highly motivated to drive.<br />
Table 1: Correlations <strong>of</strong> personal characteristics and anger levels <strong>in</strong> the first study<br />
1 2 3 4 5<br />
1 Anger -<br />
2 Gender -.071 -<br />
3 Mileage .015 -.054 -<br />
4 Driv<strong>in</strong>g Motivation -.059 .177 .271* -<br />
5 DAS .006 -.2 -.072 .018 -<br />
* p < .05