Determinants of Emotional Experiences in Traffic Situations ... - OPUS
Determinants of Emotional Experiences in Traffic Situations ... - OPUS
Determinants of Emotional Experiences in Traffic Situations ... - OPUS

You also want an ePaper? Increase the reach of your titles
YUMPU automatically turns print PDFs into web optimized ePapers that Google loves.
The <strong>Emotional</strong> Spectrum <strong>in</strong> <strong>Traffic</strong> Situation 54!<br />
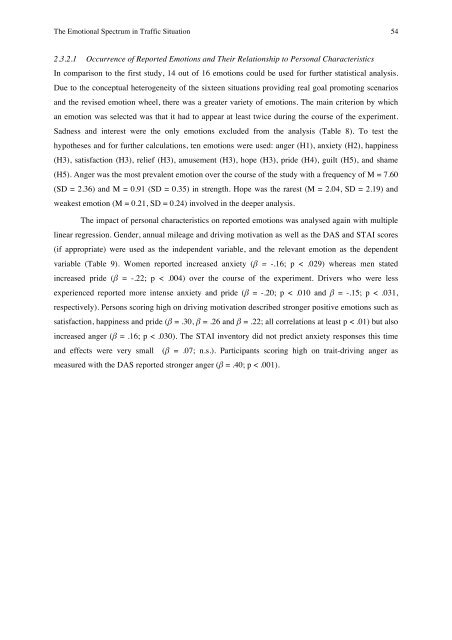
2.3.2.1 Occurrence <strong>of</strong> Reported Emotions and Their Relationship to Personal Characteristics<br />
In comparison to the first study, 14 out <strong>of</strong> 16 emotions could be used for further statistical analysis.<br />
Due to the conceptual heterogeneity <strong>of</strong> the sixteen situations provid<strong>in</strong>g real goal promot<strong>in</strong>g scenarios<br />
and the revised emotion wheel, there was a greater variety <strong>of</strong> emotions. The ma<strong>in</strong> criterion by which<br />
an emotion was selected was that it had to appear at least twice dur<strong>in</strong>g the course <strong>of</strong> the experiment.<br />
Sadness and <strong>in</strong>terest were the only emotions excluded from the analysis (Table 8). To test the<br />
hypotheses and for further calculations, ten emotions were used: anger (H1), anxiety (H2), happ<strong>in</strong>ess<br />
(H3), satisfaction (H3), relief (H3), amusement (H3), hope (H3), pride (H4), guilt (H5), and shame<br />
(H5). Anger was the most prevalent emotion over the course <strong>of</strong> the study with a frequency <strong>of</strong> M = 7.60<br />
(SD = 2.36) and M = 0.91 (SD = 0.35) <strong>in</strong> strength. Hope was the rarest (M = 2.04, SD = 2.19) and<br />
weakest emotion (M = 0.21, SD = 0.24) <strong>in</strong>volved <strong>in</strong> the deeper analysis.<br />
The impact <strong>of</strong> personal characteristics on reported emotions was analysed aga<strong>in</strong> with multiple<br />
l<strong>in</strong>ear regression. Gender, annual mileage and driv<strong>in</strong>g motivation as well as the DAS and STAI scores<br />
(if appropriate) were used as the <strong>in</strong>dependent variable, and the relevant emotion as the dependent<br />
variable (Table 9). Women reported <strong>in</strong>creased anxiety (β = -.16; p < .029) whereas men stated<br />
<strong>in</strong>creased pride (β = -.22; p < .004) over the course <strong>of</strong> the experiment. Drivers who were less<br />
experienced reported more <strong>in</strong>tense anxiety and pride (β = -.20; p < .010 and β = -.15; p < .031,<br />
respectively). Persons scor<strong>in</strong>g high on driv<strong>in</strong>g motivation described stronger positive emotions such as<br />
satisfaction, happ<strong>in</strong>ess and pride (β = .30, β = .26 and β = .22; all correlations at least p < .01) but also<br />
<strong>in</strong>creased anger (β = .16; p < .030). The STAI <strong>in</strong>ventory did not predict anxiety responses this time<br />
and effects were very small (β = .07; n.s.). Participants scor<strong>in</strong>g high on trait-driv<strong>in</strong>g anger as<br />
measured with the DAS reported stronger anger (β = .40; p < .001).