3433-vol. 6 issue 2-3.pmd - iarfc
3433-vol. 6 issue 2-3.pmd - iarfc
3433-vol. 6 issue 2-3.pmd - iarfc

You also want an ePaper? Increase the reach of your titles
YUMPU automatically turns print PDFs into web optimized ePapers that Google loves.
96<br />
Journal of Personal Finance<br />
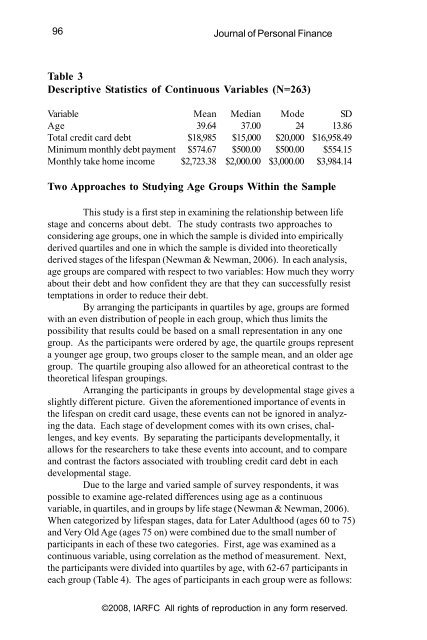
Table 3<br />
Descriptive Statistics of Continuous Variables (N=263)<br />
Variable Mean Median Mode SD<br />
Age 39.64 37.00 24 13.86<br />
Total credit card debt $18,985 $15,000 $20,000 $16,958.49<br />
Minimum monthly debt payment $574.67 $500.00 $500.00 $554.15<br />
Monthly take home income $2,723.38 $2,000.00 $3,000.00 $3,984.14<br />
Two Approaches to Studying Age Groups Within the Sample<br />
This study is a first step in examining the relationship between life<br />
stage and concerns about debt. The study contrasts two approaches to<br />
considering age groups, one in which the sample is divided into empirically<br />
derived quartiles and one in which the sample is divided into theoretically<br />
derived stages of the lifespan (Newman & Newman, 2006). In each analysis,<br />
age groups are compared with respect to two variables: How much they worry<br />
about their debt and how confident they are that they can successfully resist<br />
temptations in order to reduce their debt.<br />
By arranging the participants in quartiles by age, groups are formed<br />
with an even distribution of people in each group, which thus limits the<br />
possibility that results could be based on a small representation in any one<br />
group. As the participants were ordered by age, the quartile groups represent<br />
a younger age group, two groups closer to the sample mean, and an older age<br />
group. The quartile grouping also allowed for an atheoretical contrast to the<br />
theoretical lifespan groupings.<br />
Arranging the participants in groups by developmental stage gives a<br />
slightly different picture. Given the aforementioned importance of events in<br />
the lifespan on credit card usage, these events can not be ignored in analyzing<br />
the data. Each stage of development comes with its own crises, challenges,<br />
and key events. By separating the participants developmentally, it<br />
allows for the researchers to take these events into account, and to compare<br />
and contrast the factors associated with troubling credit card debt in each<br />
developmental stage.<br />
Due to the large and varied sample of survey respondents, it was<br />
possible to examine age-related differences using age as a continuous<br />
variable, in quartiles, and in groups by life stage (Newman & Newman, 2006).<br />
When categorized by lifespan stages, data for Later Adulthood (ages 60 to 75)<br />
and Very Old Age (ages 75 on) were combined due to the small number of<br />
participants in each of these two categories. First, age was examined as a<br />
continuous variable, using correlation as the method of measurement. Next,<br />
the participants were divided into quartiles by age, with 62-67 participants in<br />
each group (Table 4). The ages of participants in each group were as follows:<br />
©2008, IARFC All rights of reproduction in any form reserved.