

Report - ICP Forests
Report - ICP Forests
Report - ICP Forests

Create successful ePaper yourself
Turn your PDF publications into a flip-book with our unique Google optimized e-Paper software.
2. Large Scale Crown Condition Surveys 19<br />
sense. Some differences in the level of damage across national borders may be at least partly due<br />
to differences in standards used. This restriction, however, does not affect the reliability of<br />
trends over time.<br />
Natural factors strongly influence crown condition. As also stated by many participating<br />
countries, air pollution is thought to interact with natural stressors as a predisposing or<br />
accompanying factor, particularly in areas where deposition may exceed critical loads for<br />
acidification (CHAPPELKA and FREER-SMITH, 1995, CRONAN and GRIGAL, 1995,<br />
FREER-SMITH, 1998).<br />
It has been suggested that the severity of forest damage has been underestimated as a result of<br />
the replacement of dead trees by living trees in the course of regular forest management<br />
activities. However, detailed statistical analyses of the results of 10 monitoring years have<br />
revealed that the number of dead trees has remained so small that their replacement has not<br />
influenced the results notably (LORENZ et al., 1994).<br />
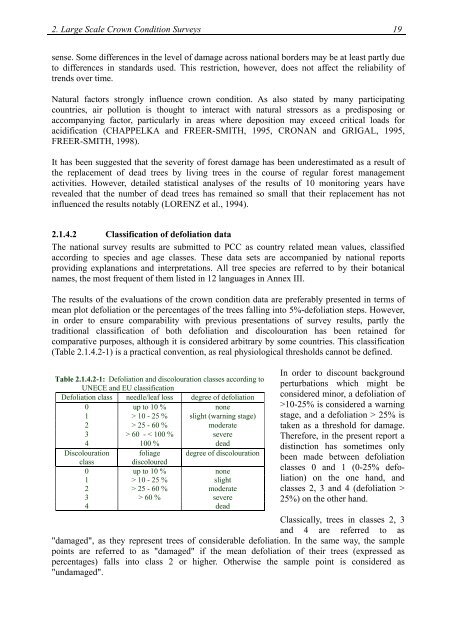
2.1.4.2 Classification of defoliation data<br />
The national survey results are submitted to PCC as country related mean values, classified<br />
according to species and age classes. These data sets are accompanied by national reports<br />
providing explanations and interpretations. All tree species are referred to by their botanical<br />
names, the most frequent of them listed in 12 languages in Annex III.<br />
The results of the evaluations of the crown condition data are preferably presented in terms of<br />
mean plot defoliation or the percentages of the trees falling into 5%-defoliation steps. However,<br />
in order to ensure comparability with previous presentations of survey results, partly the<br />
traditional classification of both defoliation and discolouration has been retained for<br />
comparative purposes, although it is considered arbitrary by some countries. This classification<br />
(Table 2.1.4.2-1) is a practical convention, as real physiological thresholds cannot be defined.<br />
Table 2.1.4.2-1: Defoliation and discolouration classes according to<br />
UNECE and EU classification<br />
Defoliation class needle/leaf loss degree of defoliation<br />
0 up to 10 % none<br />
1 > 10 - 25 % slight (warning stage)<br />
2 > 25 - 60 % moderate<br />
3 > 60 - < 100 % severe<br />
4 100 % dead<br />
Discolouration foliage degree of discolouration<br />
class discoloured<br />
0 up to 10 % none<br />
1 > 10 - 25 % slight<br />
2 > 25 - 60 % moderate<br />
3 > 60 % severe<br />
4 dead<br />
In order to discount background<br />
perturbations which might be<br />
considered minor, a defoliation of<br />
>10-25% is considered a warning<br />
stage, and a defoliation > 25% is<br />
taken as a threshold for damage.<br />
Therefore, in the present report a<br />
distinction has sometimes only<br />
been made between defoliation<br />
classes 0 and 1 (0-25% defoliation)<br />
on the one hand, and<br />
classes 2, 3 and 4 (defoliation ><br />
25%) on the other hand.<br />
Classically, trees in classes 2, 3<br />
and 4 are referred to as<br />
"damaged", as they represent trees of considerable defoliation. In the same way, the sample<br />
points are referred to as "damaged" if the mean defoliation of their trees (expressed as<br />
percentages) falls into class 2 or higher. Otherwise the sample point is considered as<br />
"undamaged".


