

Report - ICP Forests
Report - ICP Forests
Report - ICP Forests

Create successful ePaper yourself
Turn your PDF publications into a flip-book with our unique Google optimized e-Paper software.
3. Intensive Monitoring 45<br />
3. INTENSIVE MONITORING<br />
3.1 Introduction<br />
Intensive Monitoring data (Level II) for the survey year 2007 were submitted from 21 countries.<br />
In comparison to the 2006 data submission, the number of submitting countries decreased by 7.<br />
The numbers of plots with data submission per survey are given in Table 3.1-1. As not all<br />
surveys are conducted continuously or annually, the plot numbers vary from year to year.<br />
Nevertheless, compared to the 2006 data submission the number of plots decreased for most<br />
surveys. The reduction of countries and plot numbers is mostly due to the fact that for the year<br />
2007 the assessments were not co-financed by the European Commission. The methods for<br />
intensive monitoring of forest ecosystems are laid down in the “Manual on methods and criteria<br />
for harmonized sampling, assessment, monitoring and analysis of the effects of air pollution on<br />
forests” (<strong>ICP</strong> <strong>Forests</strong>, 2010).<br />
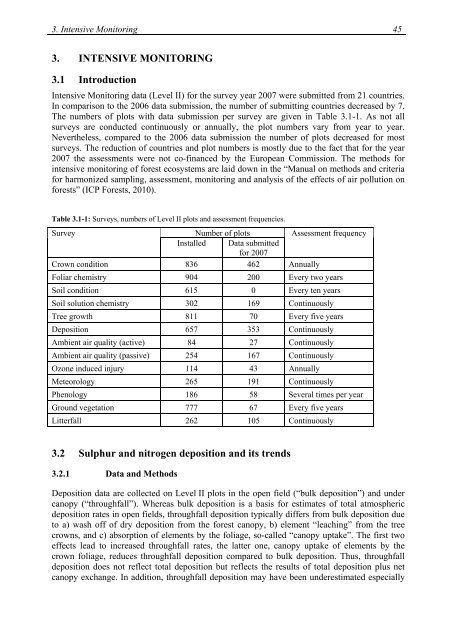
Table 3.1-1: Surveys, numbers of Level II plots and assessment frequencies.<br />
Survey Number of plots Assessment frequency<br />
Installed Data submitted<br />
for 2007<br />
Crown condition 836 462 Annually<br />
Foliar chemistry 904 200 Every two years<br />
Soil condition 615 0 Every ten years<br />
Soil solution chemistry 302 169 Continuously<br />
Tree growth 811 70 Every five years<br />
Deposition 657 353 Continuously<br />
Ambient air quality (active) 84 27 Continuously<br />
Ambient air quality (passive) 254 167 Continuously<br />
Ozone induced injury 114 43 Annually<br />
Meteorology 265 191 Continuously<br />
Phenology 186 58 Several times per year<br />
Ground vegetation 777 67 Every five years<br />
Litterfall 262 105 Continuously<br />
3.2 Sulphur and nitrogen deposition and its trends<br />
3.2.1 Data and Methods<br />
Deposition data are collected on Level II plots in the open field (“bulk deposition”) and under<br />
canopy (“throughfall”). Whereas bulk deposition is a basis for estimates of total atmospheric<br />
deposition rates in open fields, throughfall deposition typically differs from bulk deposition due<br />
to a) wash off of dry deposition from the forest canopy, b) element “leaching” from the tree<br />
crowns, and c) absorption of elements by the foliage, so-called “canopy uptake”. The first two<br />
effects lead to increased throughfall rates, the latter one, canopy uptake of elements by the<br />
crown foliage, reduces throughfall deposition compared to bulk deposition. Thus, throughfall<br />
deposition does not reflect total deposition but reflects the results of total deposition plus net<br />
canopy exchange. In addition, throughfall deposition may have been underestimated especially


