

Report - ICP Forests
Report - ICP Forests
Report - ICP Forests

Create successful ePaper yourself
Turn your PDF publications into a flip-book with our unique Google optimized e-Paper software.
3. Intensive Monitoring 79<br />
C<br />
D<br />
-4 6<br />
Juglareg<br />
Prunumah<br />
Rosa pou<br />
Arenamon<br />
Clemavit<br />
Quercpyr<br />
Quercile<br />
Genistin<br />
Pyruspyr<br />
Querccer<br />
Cardaama<br />
Alnusinc<br />
Lathyven Astragly<br />
Castasat Equisarv<br />
Rosa can<br />
Quercpub<br />
Cytissco<br />
Prunuspi<br />
Alliapet Thaliaqu<br />
Ilex aqu<br />
Sorbuari<br />
Blechspi<br />
Impatnol<br />
Ranunlan Fallocon<br />
QuercpetAthyrfil<br />
Sorbudom<br />
Stellnem<br />
Amelaova<br />
Fagussyl<br />
Cratamon<br />
Rubusfru<br />
Acer cam<br />
Malussyl<br />
Potenmic<br />
Stellhol<br />
Quercrob<br />
Anemonem Rubussax Cardafle<br />
Geranrob<br />
Cratalae<br />
Fragaves<br />
Viciasep<br />
Mercuper<br />
Lathyver<br />
Ribesalp Rosa pen<br />
Junipcom<br />
Cardahep<br />
Ranunaur<br />
-0.6 0.6<br />
N/C_org<br />
AtlS_Cli<br />
K_org<br />
AtlN_Cli<br />
Fags_Tr<br />
Age<br />
Axis 4<br />
Ndep00_EMEP<br />
CEC<br />
Qurp_Tr<br />
Ca_org<br />
Pins_Tr<br />
P_org<br />
Lat<br />
conf_Tr<br />
pH_org<br />
Lon<br />
deci_Tr<br />
Pice_Tr<br />
QurM_Tr<br />
Bor_Cli Axis 3<br />
-0.4 1.0<br />
-4 6<br />
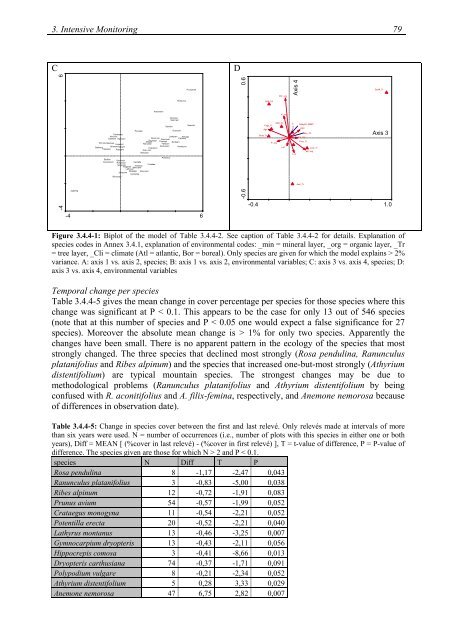
Figure 3.4.4-1: Biplot of the model of Table 3.4.4-2. See caption of Table 3.4.4-2 for details. Explanation of<br />
species codes in Annex 3.4.1, explanation of environmental codes: _min = mineral layer, _org = organic layer, _Tr<br />
= tree layer, _Cli = climate (Atl = atlantic, Bor = boreal). Only species are given for which the model explains > 2%<br />
variance. A: axis 1 vs. axis 2, species; B: axis 1 vs. axis 2, environmental variables; C: axis 3 vs. axis 4, species; D:<br />
axis 3 vs. axis 4, environmental variables<br />
Temporal change per species<br />
Table 3.4.4-5 gives the mean change in cover percentage per species for those species where this<br />
change was significant at P < 0.1. This appears to be the case for only 13 out of 546 species<br />
(note that at this number of species and P < 0.05 one would expect a false significance for 27<br />
species). Moreover the absolute mean change is > 1% for only two species. Apparently the<br />
changes have been small. There is no apparent pattern in the ecology of the species that most<br />
strongly changed. The three species that declined most strongly (Rosa pendulina, Ranunculus<br />
platanifolius and Ribes alpinum) and the species that increased one-but-most strongly (Athyrium<br />
distentifolium) are typical mountain species. The strongest changes may be due to<br />
methodological problems (Ranunculus platanifolius and Athyrium distentifolium by being<br />
confused with R. aconitifolius and A. filix-femina, respectively, and Anemone nemorosa because<br />
of differences in observation date).<br />
Table 3.4.4-5: Change in species cover between the first and last relevé. Only relevés made at intervals of more<br />
than six years were used. N = number of occurrences (i.e., number of plots with this species in either one or both<br />
years), Diff = MEAN [ (%cover in last relevé) - (%cover in first relevé) ], T = t-value of difference, P = P-value of<br />
difference. The species given are those for which N > 2 and P < 0.1.<br />
species N Diff T P<br />
Rosa pendulina 8 -1,17 -2,47 0,043<br />
Ranunculus platanifolius 3 -0,83 -5,00 0,038<br />
Ribes alpinum 12 -0,72 -1,91 0,083<br />
Prunus avium 54 -0,57 -1,99 0,052<br />
Crataegus monogyna 11 -0,54 -2,21 0,052<br />
Potentilla erecta 20 -0,52 -2,21 0,040<br />
Lathyrus montanus 13 -0,46 -3,25 0,007<br />
Gymnocarpium dryopteris 13 -0,43 -2,11 0,056<br />
Hippocrepis comosa 3 -0,41 -8,66 0,013<br />
Dryopteris carthusiana 74 -0,37 -1,71 0,091<br />
Polypodium vulgare 8 -0,21 -2,34 0,052<br />
Athyrium distentifolium 5 0,28 3,33 0,029<br />
Anemone nemorosa 47 6,75 2,82 0,007


