

Report - ICP Forests
Report - ICP Forests
Report - ICP Forests

You also want an ePaper? Increase the reach of your titles
YUMPU automatically turns print PDFs into web optimized ePapers that Google loves.
50 3. Intensive Monitoring<br />
3.2.2.2 Temporal variation<br />
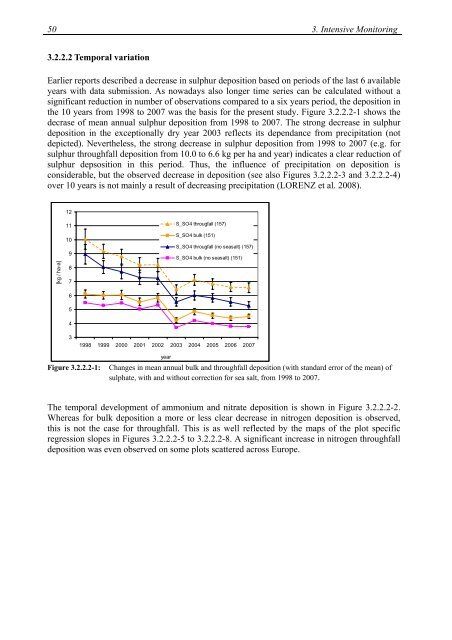
Earlier reports described a decrease in sulphur deposition based on periods of the last 6 available<br />
years with data submission. As nowadays also longer time series can be calculated without a<br />
significant reduction in number of observations compared to a six years period, the deposition in<br />
the 10 years from 1998 to 2007 was the basis for the present study. Figure 3.2.2.2-1 shows the<br />
decrase of mean annual sulphur deposition from 1998 to 2007. The strong decrease in sulphur<br />
deposition in the exceptionally dry year 2003 reflects its dependance from precipitation (not<br />
depicted). Nevertheless, the strong decrease in sulphur deposition from 1998 to 2007 (e.g. for<br />
sulphur throughfall deposition from 10.0 to 6.6 kg per ha and year) indicates a clear reduction of<br />
sulphur depsosition in this period. Thus, the influence of precipitation on deposition is<br />
considerable, but the observed decrease in deposition (see also Figures 3.2.2.2-3 and 3.2.2.2-4)<br />
over 10 years is not mainly a result of decreasing precipitation (LORENZ et al. 2008).<br />
12<br />
[kg / ha-a]<br />
11<br />
10<br />
9<br />
8<br />
7<br />
6<br />
5<br />
S_SO4 througfall (157)<br />
S_SO4 bulk (151)<br />
S_SO4 througfall (no seasalt) (157)<br />
S_SO4 bulk (no seasalt) (151)<br />
4<br />
3<br />
1998 1999 2000 2001 2002 2003 2004 2005 2006 2007<br />
Figure 3.2.2.2-1:<br />
year<br />
Changes in mean annual bulk and throughfall deposition (with standard error of the mean) of<br />
sulphate, with and without correction for sea salt, from 1998 to 2007.<br />
The temporal development of ammonium and nitrate deposition is shown in Figure 3.2.2.2-2.<br />
Whereas for bulk deposition a more or less clear decrease in nitrogen deposition is observed,<br />
this is not the case for throughfall. This is as well reflected by the maps of the plot specific<br />
regression slopes in Figures 3.2.2.2-5 to 3.2.2.2-8. A significant increase in nitrogen throughfall<br />
deposition was even observed on some plots scattered across Europe.


