800 Series Power Analyzer PowerVision⢠Instruction Manual
800 Series Power Analyzer PowerVision⢠Instruction Manual
800 Series Power Analyzer PowerVision⢠Instruction Manual

You also want an ePaper? Increase the reach of your titles
YUMPU automatically turns print PDFs into web optimized ePapers that Google loves.
6.2 Graphs<br />
With this analysis tool, the data is displayed in either line or bar graphs, depending on the data<br />
selected. Data from more than open file may be graphed to make comparison between files easier.<br />
Each file type has slightly different graphs available.<br />
6.2.1 Creating a graph<br />
To create a graph:<br />
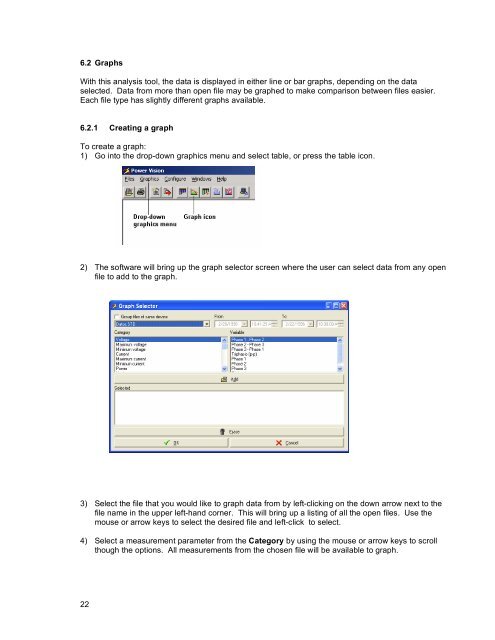
1) Go into the drop-down graphics menu and select table, or press the table icon.<br />
2) The software will bring up the graph selector screen where the user can select data from any open<br />
file to add to the graph.<br />
3) Select the file that you would like to graph data from by left-clicking on the down arrow next to the<br />
file name in the upper left-hand corner. This will bring up a listing of all the open files. Use the<br />
mouse or arrow keys to select the desired file and left-click to select.<br />
4) Select a measurement parameter from the Category by using the mouse or arrow keys to scroll<br />
though the options. All measurements from the chosen file will be available to graph.<br />
22