800 Series Power Analyzer PowerVision⢠Instruction Manual
800 Series Power Analyzer PowerVision⢠Instruction Manual
800 Series Power Analyzer PowerVision⢠Instruction Manual

Create successful ePaper yourself
Turn your PDF publications into a flip-book with our unique Google optimized e-Paper software.
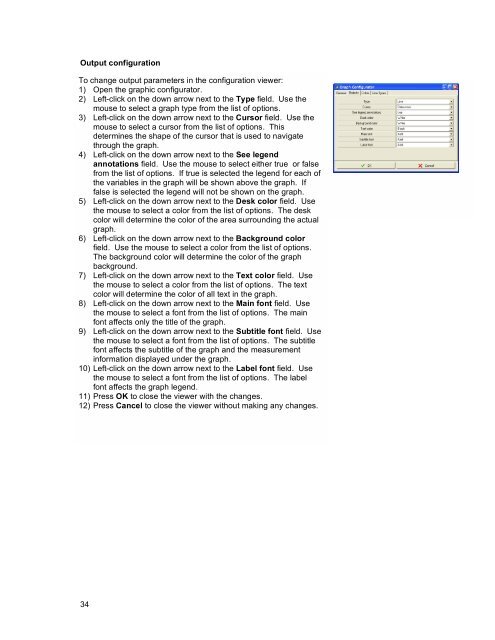
Output configuration<br />
To change output parameters in the configuration viewer:<br />
1) Open the graphic configurator.<br />
2) Left-click on the down arrow next to the Type field. Use the<br />
mouse to select a graph type from the list of options.<br />
3) Left-click on the down arrow next to the Cursor field. Use the<br />
mouse to select a cursor from the list of options. This<br />
determines the shape of the cursor that is used to navigate<br />
through the graph.<br />
4) Left-click on the down arrow next to the See legend<br />
annotations field. Use the mouse to select either true or false<br />
from the list of options. If true is selected the legend for each of<br />
the variables in the graph will be shown above the graph. If<br />
false is selected the legend will not be shown on the graph.<br />
5) Left-click on the down arrow next to the Desk color field. Use<br />
the mouse to select a color from the list of options. The desk<br />
color will determine the color of the area surrounding the actual<br />
graph.<br />
6) Left-click on the down arrow next to the Background color<br />
field. Use the mouse to select a color from the list of options.<br />
The background color will determine the color of the graph<br />
background.<br />
7) Left-click on the down arrow next to the Text color field. Use<br />
the mouse to select a color from the list of options. The text<br />
color will determine the color of all text in the graph.<br />
8) Left-click on the down arrow next to the Main font field. Use<br />
the mouse to select a font from the list of options. The main<br />
font affects only the title of the graph.<br />
9) Left-click on the down arrow next to the Subtitle font field. Use<br />
the mouse to select a font from the list of options. The subtitle<br />
font affects the subtitle of the graph and the measurement<br />
information displayed under the graph.<br />
10) Left-click on the down arrow next to the Label font field. Use<br />
the mouse to select a font from the list of options. The label<br />
font affects the graph legend.<br />
11) Press OK to close the viewer with the changes.<br />
12) Press Cancel to close the viewer without making any changes.<br />
34