800 Series Power Analyzer PowerVision⢠Instruction Manual
800 Series Power Analyzer PowerVision⢠Instruction Manual
800 Series Power Analyzer PowerVision⢠Instruction Manual

You also want an ePaper? Increase the reach of your titles
YUMPU automatically turns print PDFs into web optimized ePapers that Google loves.
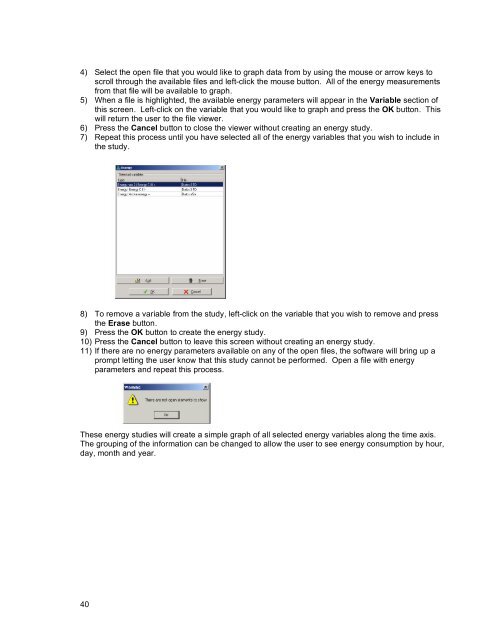
4) Select the open file that you would like to graph data from by using the mouse or arrow keys to<br />
scroll through the available files and left-click the mouse button. All of the energy measurements<br />
from that file will be available to graph.<br />
5) When a file is highlighted, the available energy parameters will appear in the Variable section of<br />
this screen. Left-click on the variable that you would like to graph and press the OK button. This<br />
will return the user to the file viewer.<br />
6) Press the Cancel button to close the viewer without creating an energy study.<br />
7) Repeat this process until you have selected all of the energy variables that you wish to include in<br />
the study.<br />
8) To remove a variable from the study, left-click on the variable that you wish to remove and press<br />
the Erase button.<br />
9) Press the OK button to create the energy study.<br />
10) Press the Cancel button to leave this screen without creating an energy study.<br />
11) If there are no energy parameters available on any of the open files, the software will bring up a<br />
prompt letting the user know that this study cannot be performed. Open a file with energy<br />
parameters and repeat this process.<br />
These energy studies will create a simple graph of all selected energy variables along the time axis.<br />
The grouping of the information can be changed to allow the user to see energy consumption by hour,<br />
day, month and year.<br />
40