improving music mood classification using lyrics, audio and social tags
improving music mood classification using lyrics, audio and social tags
improving music mood classification using lyrics, audio and social tags
Create successful ePaper yourself
Turn your PDF publications into a flip-book with our unique Google optimized e-Paper software.
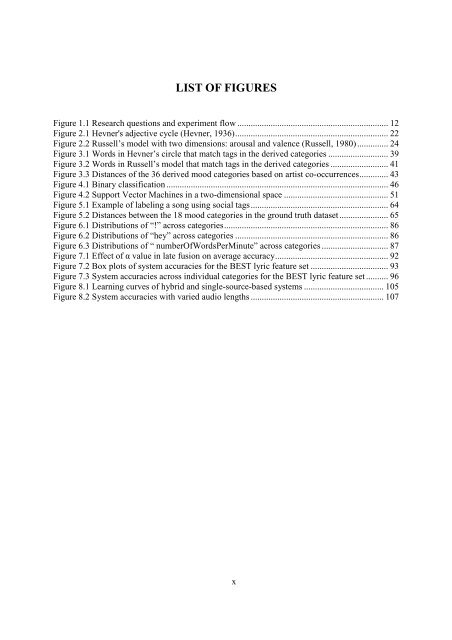
LIST OF FIGURES<br />
Figure 1.1 Research questions <strong>and</strong> experiment flow .................................................................... 12<br />
Figure 2.1 Hevner's adjective cycle (Hevner, 1936) ..................................................................... 22<br />
Figure 2.2 Russell’s model with two dimensions: arousal <strong>and</strong> valence (Russell, 1980) .............. 24<br />
Figure 3.1 Words in Hevner’s circle that match <strong>tags</strong> in the derived categories ........................... 39<br />
Figure 3.2 Words in Russell’s model that match <strong>tags</strong> in the derived categories .......................... 41<br />
Figure 3.3 Distances of the 36 derived <strong>mood</strong> categories based on artist co-occurrences ............. 43<br />
Figure 4.1 Binary <strong>classification</strong> .................................................................................................... 46<br />
Figure 4.2 Support Vector Machines in a two-dimensional space ............................................... 51<br />
Figure 5.1 Example of labeling a song <strong>using</strong> <strong>social</strong> <strong>tags</strong> .............................................................. 64<br />
Figure 5.2 Distances between the 18 <strong>mood</strong> categories in the ground truth dataset ...................... 65<br />
Figure 6.1 Distributions of “!” across categories .......................................................................... 86<br />
Figure 6.2 Distributions of “hey” across categories ..................................................................... 86<br />
Figure 6.3 Distributions of “ numberOfWordsPerMinute” across categories .............................. 87<br />
Figure 7.1 Effect of α value in late fusion on average accuracy ................................................... 92<br />
Figure 7.2 Box plots of system accuracies for the BEST lyric feature set ................................... 93<br />
Figure 7.3 System accuracies across individual categories for the BEST lyric feature set .......... 96<br />
Figure 8.1 Learning curves of hybrid <strong>and</strong> single-source-based systems .................................... 105<br />
Figure 8.2 System accuracies with varied <strong>audio</strong> lengths ............................................................ 107<br />
x


