improving music mood classification using lyrics, audio and social tags
improving music mood classification using lyrics, audio and social tags
improving music mood classification using lyrics, audio and social tags

You also want an ePaper? Increase the reach of your titles
YUMPU automatically turns print PDFs into web optimized ePapers that Google loves.
in today’s <strong>music</strong> listening environment. Hence, the MIR experiments <strong>using</strong> four <strong>mood</strong> categories<br />
based on Russell’s model have been trying to solve part of the real problem, but not even close to<br />
the complete problem. However, let us recall that Russell’s model is a dimensional model instead<br />
of a categorical one, <strong>and</strong> thus it can be extended to include more adjectives. In fact, later studies<br />
have extended this model in many different ways (Schubert, 1996; Thayer, 1989; Tyler, 1996). It<br />
is possible that many, if not all, <strong>tags</strong> in the derived categories could find their places in the twodimensional<br />
space, but it is a topic beyond the scope of this dissertation.<br />
3.3.3 Distances between Categories<br />
Both Hevner’s circle <strong>and</strong> Russell’s space demonstrate relative distances between <strong>mood</strong>s. For<br />
instance, in Russell’s space, “sad” <strong>and</strong> “happy,” “calm” <strong>and</strong> “angry” are at opposite places while<br />
“happy” <strong>and</strong> “glad” are close to each other.<br />
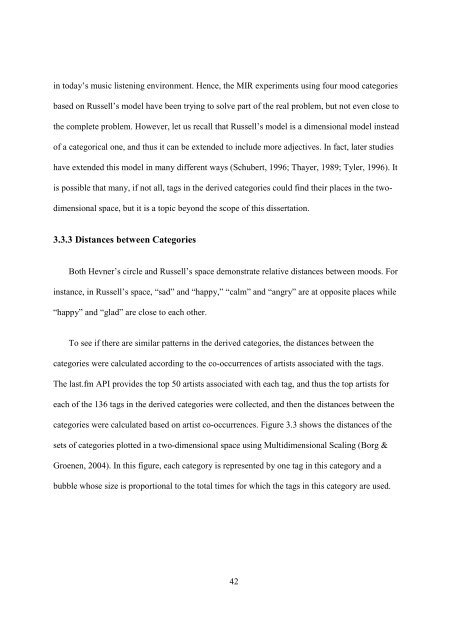
To see if there are similar patterns in the derived categories, the distances between the<br />
categories were calculated according to the co-occurrences of artists associated with the <strong>tags</strong>.<br />
The last.fm API provides the top 50 artists associated with each tag, <strong>and</strong> thus the top artists for<br />
each of the 136 <strong>tags</strong> in the derived categories were collected, <strong>and</strong> then the distances between the<br />
categories were calculated based on artist co-occurrences. Figure 3.3 shows the distances of the<br />
sets of categories plotted in a two-dimensional space <strong>using</strong> Multidimensional Scaling (Borg &<br />
Groenen, 2004). In this figure, each category is represented by one tag in this category <strong>and</strong> a<br />
bubble whose size is proportional to the total times for which the <strong>tags</strong> in this category are used.<br />
42