Nashville Area Indian Health Service 2011 Annual Report
Nashville Area Indian Health Service 2011 Annual Report
Nashville Area Indian Health Service 2011 Annual Report

Create successful ePaper yourself
Turn your PDF publications into a flip-book with our unique Google optimized e-Paper software.
OFFICE OF PUBLIC HEALTH<br />
Figure 3: GPRA Dental Goals<br />
20<br />
15<br />
10<br />
5<br />
0<br />
GPRA Indicators Met<br />
17<br />
15<br />
12<br />
12 12<br />
9<br />
4<br />
3<br />
GPRA Year 2006 GPRA Year <strong>2011</strong><br />
Met Access Goal<br />
Met Sealant Goal<br />
Met Fluoride Goal Met All Goals<br />
Tribe of Louisiana and the Eastern Band of Cherokee <strong>Indian</strong>s. In the “Most<br />
Improved Dental GPRA Performance” category, the Coushatta Tribe of Louisiana<br />
received honorable mention. Indeed, the <strong>Area</strong>’s dental program has shown<br />
significant growth and improvement over the past five years (See Figure 3).<br />
Training<br />
The <strong>Nashville</strong> <strong>Area</strong> is the only IHS <strong>Area</strong> that offers regular continuing dental<br />
education to all clinical dental staff. This is done through monthly conference<br />
calls, in order to help defray costs to <strong>Nashville</strong> <strong>Area</strong> Tribes for continuing dental<br />
education and provide standardization for dental programs in the <strong>Area</strong>.<br />
In FY <strong>2011</strong>, the <strong>Nashville</strong> <strong>Area</strong> held 11 monthly continuing education (CE)<br />
conference calls and offered a total of 32 continuing education credits. There were<br />
261 participants on these calls. Over the 5-year history of the <strong>Area</strong> continuing<br />
dental education program, almost 160 hours of continuing education have been<br />
provided, enough to meet all state licensure requirements (See Figure 4).<br />
Additional training activities in which the ADO was involved in FY <strong>2011</strong> included<br />
presenting “From Management to Leadership at the <strong>Nashville</strong> <strong>Area</strong> Leader-to-<br />
Leader Conference; holding the <strong>Nashville</strong> <strong>Area</strong> <strong>Annual</strong> Dental Meeting with 32<br />
participants; and serving as the invited speaker at numerous national conferences,<br />
including Advances in <strong>Indian</strong> <strong>Health</strong>, the <strong>2011</strong> <strong>Nashville</strong> <strong>Area</strong> Medical<br />
Conference, and the American Dental Association Conference.<br />
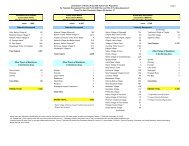
Figure 4: Continuing Dental Education Program<br />
Number of Continuing Education (CE) Hours Offered<br />
Year Monthly CE Calls <strong>Health</strong> Summit Total CE Offered<br />
2007 8 21.25 29.25<br />
2008 10 18.75 28.75<br />
2009 11 17.75 28.75<br />
2010 21 19.00 40.00<br />
<strong>2011</strong> 11 21.00 32.00<br />
Total CE 61 97.75 158.75<br />
Did you know?<br />
There were approximately 500,000 direct outpatient visits in FY <strong>2011</strong>.<br />
<strong>Nashville</strong> <strong>Area</strong> <strong>Indian</strong> <strong>Health</strong> <strong>Service</strong> www.facebook.com/IHSNAO 59