4.0 - Imperial
4.0 - Imperial
4.0 - Imperial

You also want an ePaper? Increase the reach of your titles
YUMPU automatically turns print PDFs into web optimized ePapers that Google loves.
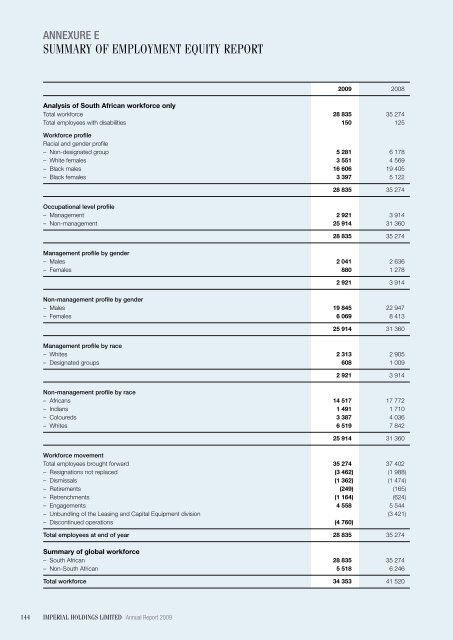
ANNEXURE E<br />
summary of employment equity report<br />
2009 2008<br />
Analysis of South African workforce only<br />
Total workforce 28 835 35 274<br />
Total employees with disabilities 150 125<br />
Workforce profile<br />
Racial and gender profile<br />
– Non-designated group 5 281 6 178<br />
– White females 3 551 4 569<br />
– Black males 16 606 19 405<br />
– Black females 3 397 5 122<br />
28 835 35 274<br />
Occupational level profile<br />
– Management 2 921 3 914<br />
– Non-management 25 914 31 360<br />
28 835 35 274<br />
Management profile by gender<br />
– Males 2 041 2 636<br />
– Females 880 1 278<br />
2 921 3 914<br />
Non-management profile by gender<br />
– Males 19 845 22 947<br />
– Females 6 069 8 413<br />
25 914 31 360<br />
Management profile by race<br />
– Whites 2 313 2 905<br />
– Designated groups 608 1 009<br />
2 921 3 914<br />
Non-management profile by race<br />
– Africans 14 517 17 772<br />
– Indians 1 491 1 710<br />
– Coloureds 3 387 4 036<br />
– Whites 6 519 7 842<br />
25 914 31 360<br />
Workforce movement<br />
Total employees brought forward 35 274 37 402<br />
– Resignations not replaced (3 462) (1 988)<br />
– Dismissals (1 362) (1 474)<br />
– Retirements (249) (165)<br />
– Retrenchments (1 164) (624)<br />
– Engagements 4 558 5 544<br />
– Unbundling of the Leasing and Capital Equipment division (3 421)<br />
– Discontinued operations (4 760)<br />
Total employees at end of year 28 835 35 274<br />
Summary of global workforce<br />
– South African 28 835 35 274<br />
– Non-South African 5 518 6 246<br />
Total workforce 34 353 41 520<br />
144<br />
<strong>Imperial</strong> holdings limited Annual Report 2009