4.0 - Imperial
4.0 - Imperial
4.0 - Imperial

You also want an ePaper? Increase the reach of your titles
YUMPU automatically turns print PDFs into web optimized ePapers that Google loves.
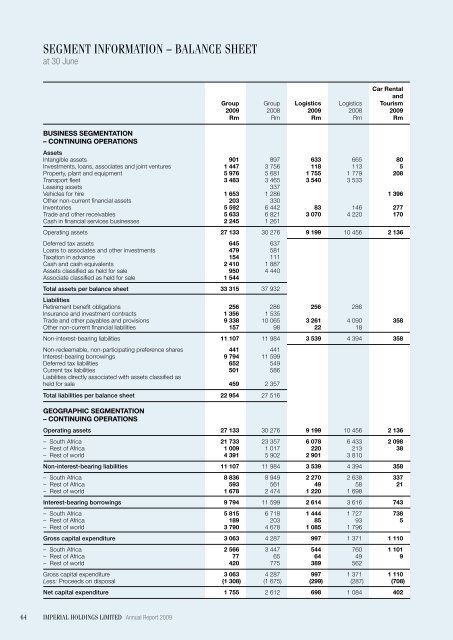
segment information – balance sheet<br />
at 30 June<br />
BuSINESS SEGMENTATION<br />
– CONTINuING OPERATIONS<br />
Car Rental<br />
and<br />
Group Group Logistics Logistics Tourism<br />
2009 2008 2009 2008 2009<br />
Rm Rm Rm Rm Rm<br />
Assets<br />
Intangible assets 901 897 633 665 80<br />
Investments, loans, associates and joint ventures 1 447 3 756 118 113 5<br />
Property, plant and equipment 5 976 5 681 1 755 1 779 208<br />
Transport fleet 3 483 3 465 3 540 3 533<br />
Leasing assets 337<br />
Vehicles for hire 1 653 1 286 1 396<br />
Other non-current financial assets 203 330<br />
Inventories 5 592 6 442 83 146 277<br />
Trade and other receivables 5 633 6 821 3 070 4 220 170<br />
Cash in financial services businesses 2 245 1 261<br />
Operating assets 27 133 30 276 9 199 10 456 2 136<br />
Deferred tax assets 645 637<br />
Loans to associates and other investments 479 581<br />
Taxation in advance 154 111<br />
Cash and cash equivalents 2 410 1 887<br />
Assets classified as held for sale 950 4 440<br />
Associate classified as held for sale 1 544<br />
Total assets per balance sheet 33 315 37 932<br />
Liabilities<br />
Retirement benefit obligations 256 286 256 286<br />
Insurance and investment contracts 1 356 1 535<br />
Trade and other payables and provisions 9 338 10 065 3 261 4 090 358<br />
Other non-current financial liabilities 157 98 22 18<br />
Non-interest-bearing liabilities 11 107 11 984 3 539 4 394 358<br />
Non-redeemable, non-participating preference shares 441 441<br />
Interest-bearing borrowings 9 794 11 599<br />
Deferred tax liabilities 652 549<br />
Current tax liabilities 501 586<br />
Liabilities directly associated with assets classified as<br />
held for sale 459 2 357<br />
Total liabilities per balance sheet 22 954 27 516<br />
GEOGRAPHIC SEGMENTATION<br />
– CONTINuING OPERATIONS<br />
Operating assets 27 133 30 276 9 199 10 456 2 136<br />
– South Africa 21 733 23 357 6 078 6 433 2 098<br />
– Rest of Africa 1 009 1 017 220 213 38<br />
– Rest of world 4 391 5 902 2 901 3 810<br />
Non-interest-bearing liabilities 11 107 11 984 3 539 4 394 358<br />
– South Africa 8 836 8 949 2 270 2 638 337<br />
– Rest of Africa 593 561 49 58 21<br />
– Rest of world 1 678 2 474 1 220 1 698<br />
Interest-bearing borrowings 9 794 11 599 2 614 3 616 743<br />
– South Africa 5 815 6 718 1 444 1 727 738<br />
– Rest of Africa 189 203 85 93 5<br />
– Rest of world 3 790 4 678 1 085 1 796<br />
Gross capital expenditure 3 063 4 287 997 1 371 1 110<br />
– South Africa 2 566 3 447 544 760 1 101<br />
– Rest of Africa 77 65 64 49 9<br />
– Rest of world 420 775 389 562<br />
Gross capital expenditure 3 063 4 287 997 1 371 1 110<br />
Less: Proceeds on disposal (1 308) (1 675) (299) (287) (708)<br />
Net capital expenditure 1 755 2 612 698 1 084 402<br />
64<br />
<strong>Imperial</strong> holdings limited Annual Report 2009