Annual Report 2012 - Indesit
Annual Report 2012 - Indesit
Annual Report 2012 - Indesit

You also want an ePaper? Increase the reach of your titles
YUMPU automatically turns print PDFs into web optimized ePapers that Google loves.
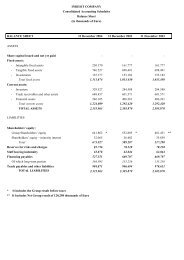
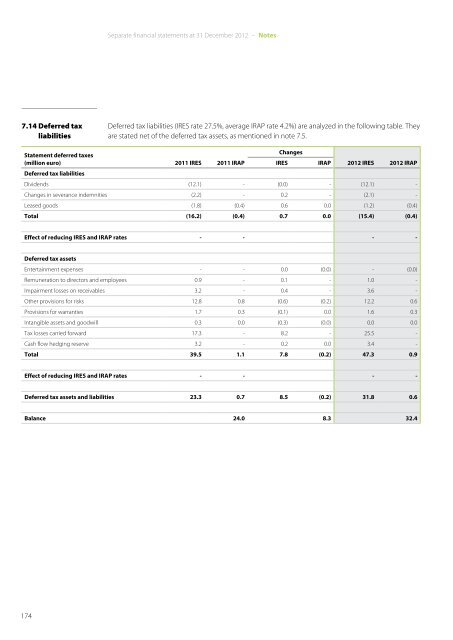
Separate financial statements at 31 December <strong>2012</strong> – Notes<br />
7.14 Deferred tax<br />
liabilities<br />
Deferred tax liabilities (IRES rate 27.5%, average IRAP rate 4.2%) are analyzed in the following table. They<br />
are stated net of the deferred tax assets, as mentioned in note 7.5.<br />
Statement deferred taxes<br />
(million euro) 2011 IRES 2011 IRAP<br />
Changes<br />
IRES<br />
IRAP <strong>2012</strong> IRES <strong>2012</strong> IRAP<br />
Deferred tax liabilities<br />
Dividends (12.1) - (0.0) - (12.1) -<br />
Changes in severance indemnities (2.2) - 0.2 - (2.1) -<br />
Leased goods (1.8) (0.4) 0.6 0.0 (1.2) (0.4)<br />
Total (16.2) (0.4) 0.7 0.0 (15.4) (0.4)<br />
Effect of reducing Ires and Irap rates - - - -<br />
Deferred tax assets<br />
Entertainment expenses - - 0.0 (0.0) - (0.0)<br />
Remuneration to directors and employees 0.9 - 0.1 - 1.0 -<br />
Impairment losses on receivables 3.2 - 0.4 - 3.6 -<br />
Other provisions for risks 12.8 0.8 (0.6) (0.2) 12.2 0.6<br />
Provisions for warranties 1.7 0.3 (0.1) 0.0 1.6 0.3<br />
Intangible assets and goodwill 0.3 0.0 (0.3) (0.0) 0.0 0.0<br />
Tax losses carried forward 17.3 - 8.2 - 25.5 -<br />
Cash flow hedging reserve 3.2 - 0.2 0.0 3.4 -<br />
Total 39.5 1.1 7.8 (0.2) 47.3 0.9<br />
Effect of reducing Ires and Irap rates - - - -<br />
Deferred tax assets and liabilities 23.3 0.7 8.5 (0.2) 31.8 0.6<br />
Balance 24.0 8.3 32.4<br />
174