Annual Report 2012 - Indesit
Annual Report 2012 - Indesit
Annual Report 2012 - Indesit

Create successful ePaper yourself
Turn your PDF publications into a flip-book with our unique Google optimized e-Paper software.
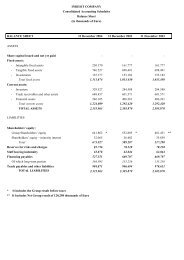
<strong>Report</strong> on operations at 31 December <strong>2012</strong><br />
Other operating costs<br />
Advertising & promotion<br />
expenses<br />
mEur<br />
30<br />
25<br />
20<br />
18.3<br />
83<br />
19.2 18.7<br />
15<br />
16.2<br />
13.7<br />
14.9<br />
11.8<br />
11.7<br />
10<br />
5<br />
0<br />
1Q 2Q 3Q 4Q<br />
3.5%<br />
3.0%<br />
2.5%<br />
2.0%<br />
1.5%<br />
1.0%<br />
0.5%<br />
0.0%<br />
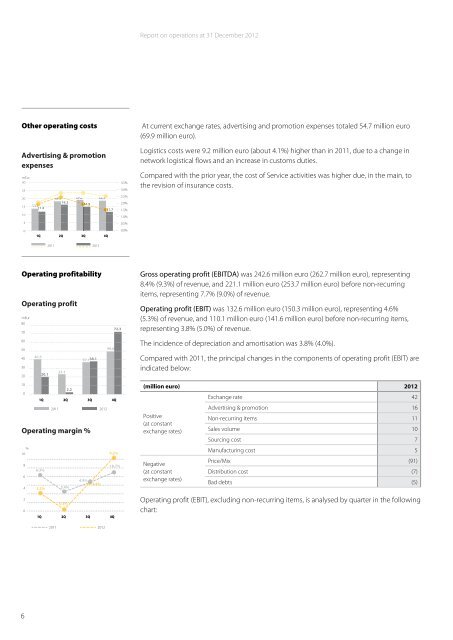
At current exchange rates, advertising and promotion expenses totaled 54.7 million euro<br />
(69.9 million euro).<br />
Logistics costs were 9.2 million euro (about 4.1%) higher than in 2011, due to a change in<br />
network logistical flows and an increase in customs duties.<br />
Compared with the prior year, the cost of Service activities was higher due, in the main, to<br />
the revision of insurance costs.<br />
2011 <strong>2012</strong><br />
Operating profitability<br />
Operating profit<br />
mEur<br />
80<br />
70<br />
60<br />
50<br />
40<br />
30<br />
40.5<br />
37.138.1<br />
20<br />
20.1<br />
23.1<br />
49.6<br />
72.3<br />
Gross operating profit (EBITDA) was 242.6 million euro (262.7 million euro), representing<br />
8.4% (9.3%) of revenue, and 221.1 million euro (253.7 million euro) before non-recurring<br />
items, representing 7.7% (9.0%) of revenue.<br />
Operating profit (EBIT) was 132.6 million euro (150.3 million euro), representing 4.6%<br />
(5.3%) of revenue, and 110.1 million euro (141.6 million euro) before non-recurring items,<br />
representing 3.8% (5.0%) of revenue.<br />
The incidence of depreciation and amortisation was 3.8% (4.0%).<br />
Compared with 2011, the principal changes in the components of operating profit (EBIT) are<br />
indicated below:<br />
10<br />
2.2<br />
0<br />
1Q 2Q 3Q 4Q<br />
2011 <strong>2012</strong><br />
Operating margin %<br />
%<br />
10<br />
8<br />
9.2%<br />
18.7%<br />
6.3%<br />
6<br />
4.9%<br />
4.8%<br />
4<br />
2<br />
3.2% 3.4%<br />
0.3%<br />
0<br />
1Q 2Q 3Q 4Q<br />
(million euro) <strong>2012</strong><br />
Exchange rate 42<br />
Advertising & promotion 16<br />
Positive<br />
Non-recurring items 11<br />
(at constant<br />
exchange rates) Sales volume 10<br />
Sourcing cost 7<br />
Manufacturing cost 5<br />
Negative<br />
Price/Mix (91)<br />
(at constant<br />
Distribution cost (7)<br />
exchange rates)<br />
Bad debts (5)<br />
Operating profit (EBIT), excluding non-recurring items, is analysed by quarter in the following<br />
chart:<br />
2011 <strong>2012</strong><br />
6