Annual Report 2012 - Indesit
Annual Report 2012 - Indesit
Annual Report 2012 - Indesit

Create successful ePaper yourself
Turn your PDF publications into a flip-book with our unique Google optimized e-Paper software.
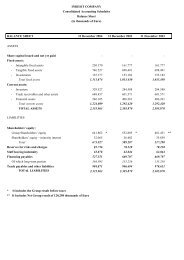
Consolidated financial statements at 31 December <strong>2012</strong> – Notes<br />
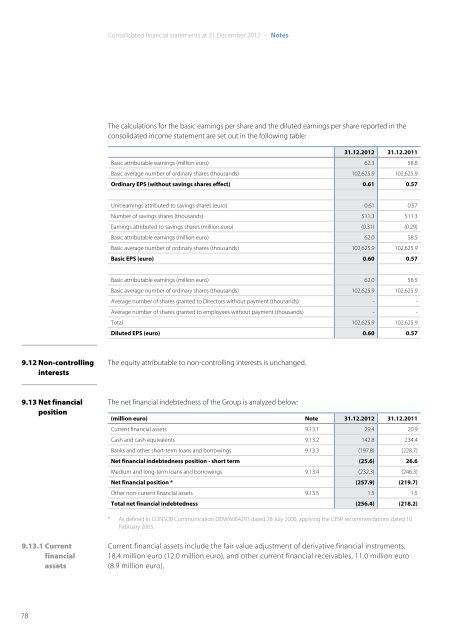
The calculations for the basic earnings per share and the diluted earnings per share reported in the<br />
consolidated income statement are set out in the following table:<br />
31.12.<strong>2012</strong> 31.12.2011<br />
Basic attributable earnings (million euro) 62.3 58.8<br />
Basic average number of ordinary shares (thousands) 102,625.9 102,625.9<br />
Ordinary EPS (without savings shares effect) 0.61 0.57<br />
Unit earnings attributed to savings shares (euro) 0.61 0.57<br />
Number of savings shares (thousands) 511.3 511.3<br />
Earnings attributed to savings shares (million euro) (0.31) (0.29)<br />
Basic attributable earnings (million euro) 62.0 58.5<br />
Basic average number of ordinary shares (thousands) 102,625.9 102,625.9<br />
Basic EPS (euro) 0.60 0.57<br />
Basic attributable earnings (million euro) 62.0 58.5<br />
Basic average number of ordinary shares (thousands) 102,625.9 102,625.9<br />
Average number of shares granted to Directors without payment (thousands) - -<br />
Average number of shares granted to employees without payment (thousands) - -<br />
Total 102,625.9 102,625.9<br />
Diluted EPS (euro) 0.60 0.57<br />
9.12 Non-controlling<br />
interests<br />
The equity attributable to non-controlling interests is unchanged.<br />
9.13 Net financial<br />
position<br />
The net financial indebtedness of the Group is analyzed below:<br />
(million euro) Note 31.12.<strong>2012</strong> 31.12.2011<br />
Current financial assets 9.13.1 29.4 20.9<br />
Cash and cash equivalents 9.13.2 142.8 234.4<br />
Banks and other short-term loans and borrowings 9.13.3 (197.8) (228.7)<br />
Net financial indebtedness position - short term (25.6) 26.6<br />
Medium and long-term loans and borrowings 9.13.4 (232.3) (246.3)<br />
Net financial position * (257.9) (219.7)<br />
Other non-current financial assets 9.13.5 1.5 1.5<br />
Total net financial indebtedness (256.4) (218.2)<br />
* As defined in CONSOB Communication DEM/6064293 dated 28 July 2006, applying the CESR recommendations dated 10<br />
February 2005.<br />
9.13.1 Current<br />
financial<br />
assets<br />
Current financial assets include the fair value adjustment of derivative financial instruments,<br />
18.4 million euro (12.0 million euro), and other current financial receivables, 11.0 million euro<br />
(8.9 million euro).<br />
78