


Create successful ePaper yourself
Turn your PDF publications into a flip-book with our unique Google optimized e-Paper software.
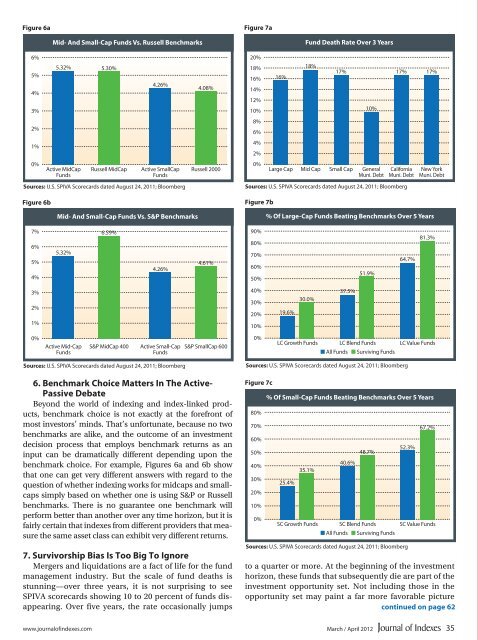
Figure 6a<br />
Figure 7a<br />
6%<br />
5%<br />
4%<br />
3%<br />
2%<br />
1%<br />
0%<br />
Mid- And Small-Cap Funds Vs. Russell Benchmarks<br />
5.32%<br />
Active MidCap<br />
Funds<br />
5.30%<br />
4.26%<br />
Russell MidCap Active SmallCap Russell 2000<br />
Funds<br />
Sources: U.S. SPIVA Scorecards dated August 24, 2011; Bloomberg<br />
Figure 6b<br />
Mid- And Small-Cap Funds Vs. S&P Benchmarks<br />
4.08%<br />
20%<br />
18%<br />
16%<br />
14%<br />
12%<br />
10%<br />
8%<br />
6%<br />
4%<br />
2%<br />
0%<br />
Fund Death Rate Over 3 Years<br />
Sources: U.S. SPIVA Scorecards dated August 24, 2011; Bloomberg<br />
Figure 7b<br />
16%<br />
18%<br />
17%<br />
10%<br />
Large Cap Mid Cap Small Cap General<br />
Muni. Debt<br />
17% 17%<br />
California<br />
Muni. Debt<br />
New York<br />
Muni. Debt<br />
% Of Large-Cap Funds Beating Benchmarks Over 5 Years<br />
7%<br />
6%<br />
5%<br />
4%<br />
5.32%<br />
6.59%<br />
4.26%<br />
4.61%<br />
90%<br />
80%<br />
70%<br />
60%<br />
50%<br />
51.9%<br />
64.7%<br />
81.3%<br />
3%<br />
2%<br />
1%<br />
40%<br />
30%<br />
20%<br />
10%<br />
19.6%<br />
30.0%<br />
37.5%<br />
0%<br />
Active Mid-Cap<br />
Funds<br />
S&P MidCap 400 Active Small-Cap S&P SmallCap 600<br />
Funds<br />
0%<br />
LC Growth Funds LC Blend Funds<br />
■ All Funds ■ Surviving Funds<br />
LC Value Funds<br />
Sources: U.S. SPIVA Scorecards dated August 24, 2011; Bloomberg<br />
6. Benchmark Choice Matters In The Active-<br />
Passive Debate<br />
Beyond <strong>the</strong> world of indexing and index-linked products,<br />
benchmark choice is not exactly at <strong>the</strong> forefront of<br />
most investors’ minds. That’s unfortunate, because no two<br />
benchmarks are alike, and <strong>the</strong> out<strong>com</strong>e of an investment<br />
decision process that employs benchmark returns as an<br />
input can be dramatically different depending upon <strong>the</strong><br />
benchmark choice. For example, Figures 6a and 6b show<br />
that one can get very different answers with regard to <strong>the</strong><br />
question of whe<strong>the</strong>r indexing works for midcaps and smallcaps<br />
simply based on whe<strong>the</strong>r one is using S&P or Russell<br />
benchmarks. There is no guarantee one benchmark will<br />
perform better than ano<strong>the</strong>r over any time horizon, but it is<br />
fairly certain that indexes from different providers that measure<br />
<strong>the</strong> same asset class can exhibit very different returns.<br />
7. Survivorship Bias Is Too Big To Ignore<br />
Mergers and liquidations are a fact of life for <strong>the</strong> fund<br />
management industry. But <strong>the</strong> scale of fund deaths is<br />
stunning—over three years, it is not surprising to see<br />
SPIVA scorecards showing 10 to 20 percent of funds disappearing.<br />
Over five years, <strong>the</strong> rate occasionally jumps<br />
Sources: U.S. SPIVA Scorecards dated August 24, 2011; Bloomberg<br />
Figure 7c<br />
80%<br />
70%<br />
60%<br />
50%<br />
40%<br />
30%<br />
20%<br />
10%<br />
0%<br />
% Of Small-Cap Funds Beating Benchmarks Over 5 Years<br />
25.4%<br />
35.1%<br />
SC Growth Funds<br />
40.6%<br />
48.7%<br />
SC Blend Funds<br />
■ All Funds ■ Surviving Funds<br />
Sources: U.S. SPIVA Scorecards dated August 24, 2011; Bloomberg<br />
52.3%<br />
67.2%<br />
SC Value Funds<br />
to a quarter or more. At <strong>the</strong> beginning of <strong>the</strong> investment<br />
horizon, <strong>the</strong>se funds that subsequently die are part of <strong>the</strong><br />
investment opportunity set. Not including those in <strong>the</strong><br />
opportunity set may paint a far more favorable picture<br />
continued on page 62<br />
www.journalofindexes.<strong>com</strong> March / April 2012 35


