


You also want an ePaper? Increase the reach of your titles
YUMPU automatically turns print PDFs into web optimized ePapers that Google loves.
advantages be<strong>com</strong>e more stable, with an edge toward<br />
relative net outperformance. For example, Figure 3 shows<br />
that active fixed-in<strong>com</strong>e managers experience narrower<br />
return dispersion relative to equity managers.<br />
We would <strong>the</strong>refore expect costs to play a more<br />
important role over both <strong>the</strong> short term and long term<br />
for fixed-in<strong>com</strong>e managers and less so for equity managers.<br />
But as <strong>the</strong> time period extends, Figures 2 and 5<br />
show that costs be<strong>com</strong>e a primary determinant of relative<br />
performance for equity funds as well.<br />
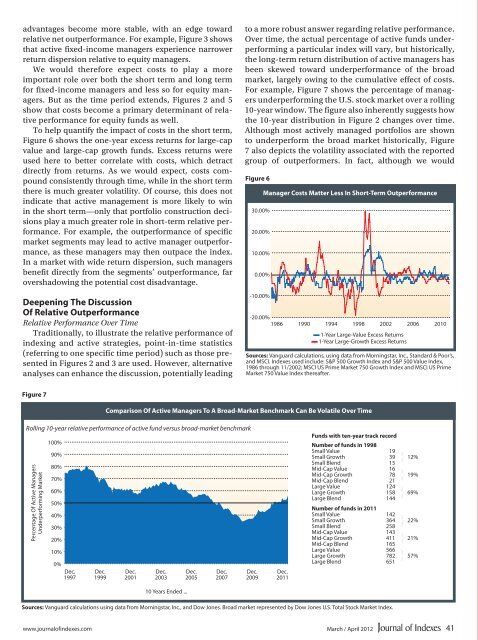
To help quantify <strong>the</strong> impact of costs in <strong>the</strong> short term,<br />
Figure 6 shows <strong>the</strong> one-year excess returns for large-cap<br />
value and large-cap growth funds. Excess returns were<br />
used here to better correlate with costs, which detract<br />
directly from returns. As we would expect, costs <strong>com</strong>pound<br />
consistently through time, while in <strong>the</strong> short term<br />
<strong>the</strong>re is much greater volatility. Of course, this does not<br />
indicate that active management is more likely to win<br />
in <strong>the</strong> short term—only that portfolio construction decisions<br />
play a much greater role in short-term relative performance.<br />
For example, <strong>the</strong> outperformance of specific<br />
market segments may lead to active manager outperformance,<br />
as <strong>the</strong>se managers may <strong>the</strong>n outpace <strong>the</strong> index.<br />
In a market with wide return dispersion, such managers<br />
benefit directly from <strong>the</strong> segments’ outperformance, far<br />
overshadowing <strong>the</strong> potential cost disadvantage.<br />
Deepening The Discussion<br />
Of Relative Outperformance<br />
Relative Performance Over Time<br />
Traditionally, to illustrate <strong>the</strong> relative performance of<br />
indexing and active strategies, point-in-time statistics<br />
(referring to one specific time period) such as those presented<br />
in Figures 2 and 3 are used. However, alternative<br />
analyses can enhance <strong>the</strong> discussion, potentially leading<br />
to a more robust answer regarding relative performance.<br />
Over time, <strong>the</strong> actual percentage of active funds underperforming<br />
a particular index will vary, but historically,<br />
<strong>the</strong> long-term return distribution of active managers has<br />
been skewed toward underperformance of <strong>the</strong> broad<br />
market, largely owing to <strong>the</strong> cumulative effect of costs.<br />
For example, Figure 7 shows <strong>the</strong> percentage of managers<br />
underperforming <strong>the</strong> U.S. stock market over a rolling<br />
10-year window. The figure also inherently suggests how<br />
<strong>the</strong> 10-year distribution in Figure 2 changes over time.<br />
Although most actively managed portfolios are shown<br />
to underperform <strong>the</strong> broad market historically, Figure<br />
7 also depicts <strong>the</strong> volatility associated with <strong>the</strong> reported<br />
group of outperformers. In fact, although we would<br />
Figure 6<br />
30.00%<br />
20.00%<br />
10.00%<br />
0.00%<br />
-10.00%<br />
Manager Costs Matter Less In Short-Term Outperformance<br />
-20.00%<br />
1986 1990 1994 1998<br />
— 1-Year Large-Value Excess Returns<br />
— 1-Year Large-Growth Excess Returns<br />
2002 2006 2010<br />
Sources: Vanguard calculations, using data from Morningstar, Inc., Standard & Poor’s,<br />
and MSCI. Indexes used include: S&P 500 Growth Index and S&P 500 Value Index,<br />
1986 through 11/2002; MSCI US Prime Market 750 Growth Index and MSCI US Prime<br />
Market 750 Value Index <strong>the</strong>reafter.<br />
Figure 7<br />
Comparison Of Active Managers To A Broad-Market Benchmark Can Be Volatile Over Time<br />
Rolling 10-year relative performance of active fund versus broad-market benchmark<br />
Percentage Of Active Managers<br />
Underperforming Market<br />
100%<br />
90%<br />
80%<br />
70%<br />
60%<br />
50%<br />
40%<br />
30%<br />
20%<br />
10%<br />
0%<br />
Dec.<br />
1997<br />
Dec.<br />
1999<br />
Dec.<br />
2001<br />
Dec.<br />
2003<br />
10 Years Ended ...<br />
Dec.<br />
2005<br />
Dec.<br />
2007<br />
Dec.<br />
2009<br />
Dec.<br />
2011<br />
Funds with ten-year track record<br />
Number of funds in 1998<br />
Small Value 19<br />
Small Growth 39<br />
}<br />
12%<br />
Small Blend 15<br />
Mid-Cap Value 16<br />
Mid-Cap Growth 78<br />
}<br />
19%<br />
Mid-Cap Blend 21<br />
Large Value 124<br />
Large Growth 158<br />
}<br />
69%<br />
Large Blend 144<br />
Number of funds in 2011<br />
Small Value 142<br />
Small Growth 364<br />
}<br />
22%<br />
Small Blend 258<br />
Mid-Cap Value 143<br />
Mid-Cap Growth 411<br />
}<br />
21%<br />
Mid-Cap Blend 165<br />
Large Value 566<br />
Large Growth 782<br />
}<br />
57%<br />
Large Blend 651<br />
Sources: Vanguard calculations using data from Morningstar, Inc., and Dow Jones. Broad market represented by Dow Jones U.S. Total Stock Market Index.<br />
www.journalofindexes.<strong>com</strong> March / April 2012 41


