


You also want an ePaper? Increase the reach of your titles
YUMPU automatically turns print PDFs into web optimized ePapers that Google loves.
An index is a <strong>the</strong>oretical “basket” of securities<br />
designed to represent a broad market or a portion<br />
of <strong>the</strong> market. By reflecting <strong>the</strong> performance<br />
of a particular market, an index provides investors with<br />
a benchmark for that market’s performance. Because<br />
indexes are, by definition, intended to mirror <strong>the</strong> market,<br />
<strong>the</strong>y are constructed to be market capitalization<br />
weighted. An indexed investment strategy such as an<br />
index mutual fund or an index-based exchange-traded<br />
fund seeks to track <strong>the</strong> performance of an index by<br />
assembling a portfolio that invests in <strong>the</strong> same group of<br />
securities, or a sampling of <strong>the</strong> securities, that <strong>com</strong>pose<br />
<strong>the</strong> index. By investing in a product designed to replicate<br />
<strong>the</strong> performance of a broad market such as <strong>the</strong> U.S. stock<br />
market, an investor can participate, at low cost, in <strong>the</strong><br />
aggregate performance of that market at all times. By <strong>the</strong><br />
same token, investing in products designed to replicate<br />
<strong>the</strong> performance of indexes with a narrower focus, such<br />
as European stocks or long-term bonds, allows an investor<br />
to participate in <strong>the</strong> purest exposure to a specific<br />
market segment within a low-cost framework. As a result<br />
of <strong>the</strong>se features, indexing has gained in popularity over<br />
time. Estimates of index fund assets, including ETFs,<br />
are as high as $2.008 trillion, or 16.9 percent of <strong>the</strong> total<br />
assets managed by registered investment <strong>com</strong>panies. 1<br />
Historically over time, an indexing investment strategy<br />
has performed favorably in relation to actively managed<br />
investment strategies, as a result of indexing’s low costs,<br />
broad diversification, minimal cash drag, and, for taxable<br />
investors, <strong>the</strong> potential for tax efficiency. Combined,<br />
<strong>the</strong>se factors represent a significant hurdle that an active<br />
manager must over<strong>com</strong>e just to break even with a lowcost<br />
index strategy over time, in any market. Of course,<br />
skilled active managers who have over<strong>com</strong>e <strong>the</strong>se hurdles<br />
do exist, but as our research and o<strong>the</strong>r empirical evidence<br />
suggest, <strong>the</strong> likelihood of outperformance by a majority<br />
of managers dwindles over time as <strong>the</strong> <strong>com</strong>pounding of<br />
costs be<strong>com</strong>es more difficult to surmount.<br />
This paper explores both <strong>the</strong> <strong>the</strong>ory underlying<br />
index investing and evidence to support its advantages.<br />
We first examine investing as a “zero-sum game”<br />
and relate it to <strong>the</strong> “index funds versus active funds”<br />
debate. We emphasize <strong>the</strong> importance of costs in investment<br />
management and <strong>the</strong>ir impact on index and active<br />
strategies. We <strong>the</strong>n offer a broader perspective on relative<br />
performance, including subasset classes, market<br />
cyclicality, and benchmark differences. We discuss, as<br />
well, excess returns as an alternate perspective on relative<br />
success. Finally, we address <strong>com</strong>mon myths regarding<br />
indexing as an investment strategy.<br />
quantitative risk-control techniques that seek to replicate<br />
<strong>the</strong> benchmark’s return with minimal expected tracking<br />
error (and, by extension, with no expected alpha, or excess<br />
return versus <strong>the</strong> benchmark). 2 In fact, <strong>the</strong> best index is not<br />
necessarily <strong>the</strong> one that provides <strong>the</strong> highest return, but<br />
<strong>the</strong> one that most accurately measures <strong>the</strong> performance of<br />
<strong>the</strong> investing style strategy or market it is intended to track.<br />
Before considering <strong>the</strong> particulars of one investment<br />
strategy versus ano<strong>the</strong>r, it is instructive to consider <strong>the</strong> market<br />
as a whole, where outperformance is often referred to as<br />
a “zero-sum game.” The concept of a zero-sum game starts<br />
with <strong>the</strong> understanding that at any given point in time, <strong>the</strong><br />
holdings of all investors in a particular market, such as <strong>the</strong><br />
U.S. stock or bond market, aggregate to form that market<br />
(Sharpe, 1991). Because all investors’ holdings are represented,<br />
if one investor’s dollars outperform <strong>the</strong> aggregate<br />
market over a particular time period, ano<strong>the</strong>r investor’s<br />
dollars must underperform, such that <strong>the</strong> dollar-weighted<br />
performance of all investors sums to equal <strong>the</strong> performance<br />
of <strong>the</strong> market. 3 Of course, this holds for any market, such as<br />
foreign stock and bond markets, or even specialized markets<br />
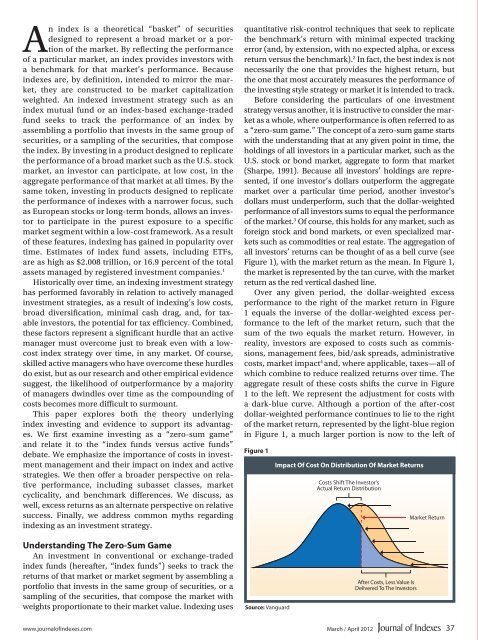
such as <strong>com</strong>modities or real estate. The aggregation of<br />
all investors’ returns can be thought of as a bell curve (see<br />
Figure 1), with <strong>the</strong> market return as <strong>the</strong> mean. In Figure 1,<br />
<strong>the</strong> market is represented by <strong>the</strong> tan curve, with <strong>the</strong> market<br />
return as <strong>the</strong> red vertical dashed line.<br />
Over any given period, <strong>the</strong> dollar-weighted excess<br />
performance to <strong>the</strong> right of <strong>the</strong> market return in Figure<br />
1 equals <strong>the</strong> inverse of <strong>the</strong> dollar-weighted excess performance<br />
to <strong>the</strong> left of <strong>the</strong> market return, such that <strong>the</strong><br />
sum of <strong>the</strong> two equals <strong>the</strong> market return. However, in<br />
reality, investors are exposed to costs such as <strong>com</strong>missions,<br />
management fees, bid/ask spreads, administrative<br />
costs, market impact 4 and, where applicable, taxes—all of<br />
which <strong>com</strong>bine to reduce realized returns over time. The<br />
aggregate result of <strong>the</strong>se costs shifts <strong>the</strong> curve in Figure<br />
1 to <strong>the</strong> left. We represent <strong>the</strong> adjustment for costs with<br />
a dark-blue curve. Although a portion of <strong>the</strong> after-cost<br />
dollar-weighted performance continues to lie to <strong>the</strong> right<br />
of <strong>the</strong> market return, represented by <strong>the</strong> light-blue region<br />
in Figure 1, a much larger portion is now to <strong>the</strong> left of<br />
Figure 1<br />
Impact Of Cost On Distribution Of Market Returns<br />
Costs Shift The Investor’s<br />
Actual Return Distribution<br />
Market Return<br />
Understanding The Zero-Sum Game<br />
An investment in conventional or exchange-traded<br />
index funds (hereafter, “index funds”) seeks to track <strong>the</strong><br />
returns of that market or market segment by assembling a<br />
portfolio that invests in <strong>the</strong> same group of securities, or a<br />
sampling of <strong>the</strong> securities, that <strong>com</strong>pose <strong>the</strong> market with<br />
weights proportionate to <strong>the</strong>ir market value. Indexing uses<br />
Source: Vanguard<br />
After Costs, Less Value Is<br />
Delivered To The Investors<br />
www.journalofindexes.<strong>com</strong> March / April 2012 37


