FY 2010 Annual Report - Part II - Orascom Development
FY 2010 Annual Report - Part II - Orascom Development
FY 2010 Annual Report - Part II - Orascom Development

Create successful ePaper yourself
Turn your PDF publications into a flip-book with our unique Google optimized e-Paper software.
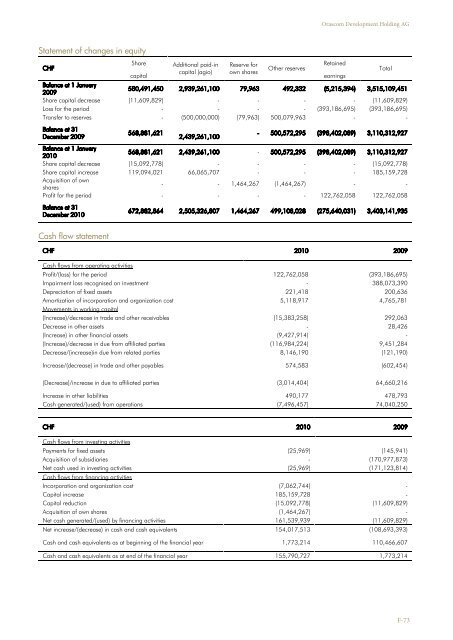
<strong>Orascom</strong> <strong>Development</strong> Holding AG<br />
Statement of changes in equity<br />
CHF<br />
Share<br />
capital<br />
Additional paid-in<br />
capital (agio)<br />
Reserve for<br />
own shares<br />
Other reserves<br />
Retained<br />
earnings<br />
Balance at 1 January<br />
2009<br />
580,491,450 2,939,261,100 79,963 492,332 (5,215,394) 3,515,109,451<br />
Share capital decrease (11,609,829) - - - - (11,609,829)<br />
Loss for the period - - - - (393,186,695) (393,186,695)<br />
Transfer to reserves - (500,000,000) (79,963) 500,079,963 - -<br />
Balance at 31<br />
December 2009<br />
568,881,621<br />
2,439,261,100<br />
Total<br />
- 500,572,295 (398,402,089) 3,110,312,927<br />
Balance at 1 January<br />
<strong>2010</strong><br />
568,881,621 2,439,261,100 - 500,572,295 (398,402,089) 3,110,312,927<br />
Share capital decrease (15,092,778) - - - - (15,092,778)<br />
Share capital increase 119,094,021 66,065,707 - - - 185,159,728<br />
Acquisition of own<br />
shares<br />
- - 1,464,267 (1,464,267) - -<br />
Profit for the period - - - - 122,762,058 122,762,058<br />
Balance at 31<br />
December <strong>2010</strong><br />
Cash flow statement<br />
672,882,864 2,505,326,807 1,464,267 499,108,028 (275,640,031) 3,403,141,935<br />
CHF <strong>2010</strong> 2009<br />
Cash flows from operating activities<br />
Profit/(loss) for the period 122,762,058 (393,186,695)<br />
Impairment loss recognised on investment - 388,073,390<br />
Depreciation of fixed assets 221,418 200,636<br />
Amortization of incorporation and organization cost 5,118,917 4,765,781<br />
Movements in working capital<br />
(Increase)/decrease in trade and other receivables (15,383,258) 292,063<br />
Decrease in other assets - 28,426<br />
(Increase) in other financial assets (9,427,914) -<br />
(Increase)/decrease in due from affiliated parties (116,984,224) 9,451,284<br />
Decrease/(increase)in due from related parties 8,146,190 (121,190)<br />
Increase/(decrease) in trade and other payables 574,583 (602,454)<br />
(Decrease)/increase in due to affiliated parties (3,014,404) 64,660,216<br />
Increase in other liabilities 490,177 478,793<br />
Cash generated/(used) from operations (7,496,457) 74,040,250<br />
CHF <strong>2010</strong> 2009<br />
Cash flows from investing activities<br />
Payments for fixed assets (25,969) (145,941)<br />
Acquisition of subsidiaries - (170,977,873)<br />
Net cash used in investing activities (25,969) (171,123,814)<br />
Cash flows from financing activities<br />
Incorporation and organization cost (7,062,744) -<br />
Capital increase 185,159,728 -<br />
Capital reduction (15,092,778) (11,609,829)<br />
Acquisition of own shares (1,464,267) -<br />
Net cash generated/(used) by financing activities 161,539,939 (11,609,829)<br />
Net increase/(decrease) in cash and cash equivalents 154,017,513 (108,693,393)<br />
Cash and cash equivalents as at beginning of the financial year 1,773,214 110,466,607<br />
Cash and cash equivalents as at end of the financial year 155,790,727 1,773,214<br />
F-73