Linking Specialisation and Stability of Plant ... - OPUS Würzburg
Linking Specialisation and Stability of Plant ... - OPUS Würzburg
Linking Specialisation and Stability of Plant ... - OPUS Würzburg

You also want an ePaper? Increase the reach of your titles
YUMPU automatically turns print PDFs into web optimized ePapers that Google loves.
94 the importance <strong>of</strong> being synchronous<br />
bers compared to the other two, we multiplied all visitor numbers<br />
by a correction factor to account for this inter-observer<br />
difference <strong>and</strong> repeated the analyses presented in this paper.<br />
Using the correction did not qualitatively change the results <strong>of</strong><br />
the analyses.<br />
5.4 results<br />
5.4.1 Overall patterns<br />
In total, we observed 10504 interactions between 166 flowering<br />
plant species <strong>and</strong> 444 insect species. Flower-visiting insects included<br />
326 species <strong>of</strong> flies, 45 bees <strong>and</strong> 73 butterflies <strong>and</strong> moths.<br />
The data set comprised 67 interaction networks, <strong>of</strong> which 59<br />
were significantly specialised (mean H2’ = 0.554, SD = 0.149).<br />
5.4.2 Local specialisation<br />
Local specialization (d')<br />
1.0<br />
0.8<br />
0.6<br />
0.4<br />
0.2<br />
0.0<br />
**<br />
n = 166 n = 29 n = 27<br />
**<br />
Flies Bees Butterflies<br />
Insect group<br />
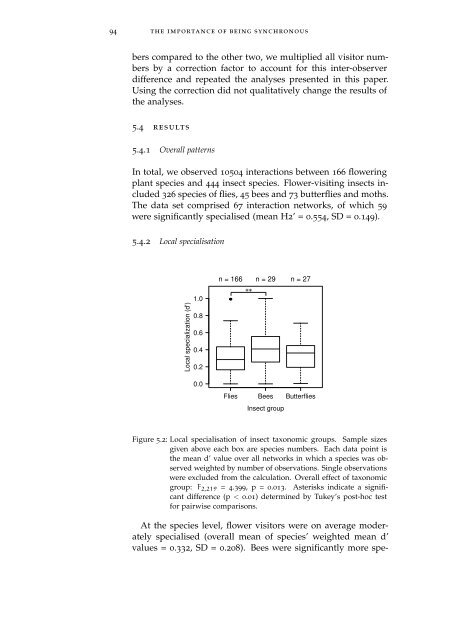
Figure 5.2: Local specialisation <strong>of</strong> insect taxonomic groups. Sample sizes<br />
given above each box are species numbers. Each data point is<br />
the mean d’ value over all networks in which a species was observed<br />
weighted by number <strong>of</strong> observations. Single observations<br />
were excluded from the calculation. Overall effect <strong>of</strong> taxonomic<br />
group: F 2,219 = 4.399, p = 0.013. Asterisks indicate a significant<br />
difference (p < 0.01) determined by Tukey’s post-hoc test<br />
for pairwise comparisons.<br />
At the species level, flower visitors were on average moderately<br />
specialised (overall mean <strong>of</strong> species’ weighted mean d’<br />
values = 0.332, SD = 0.208). Bees were significantly more spe-